Self-Hosted OpenTelemetry for Node.js on Your Own VPS
 MD Rakibul Islam RakibFull-stack developer, DevOps & Linux engineer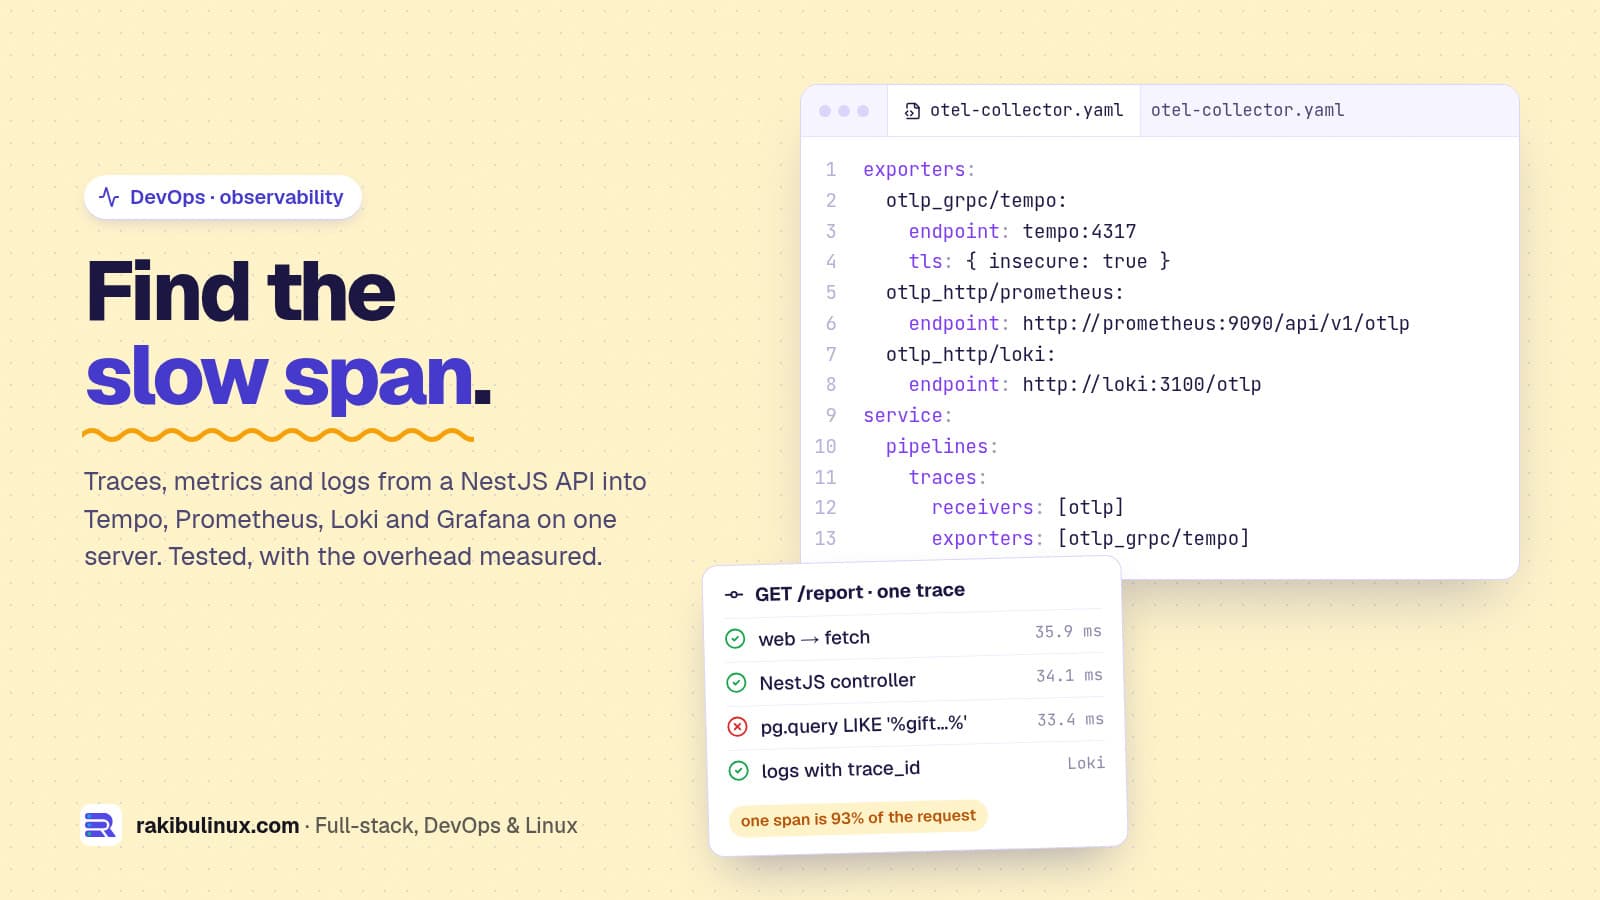
To self-host OpenTelemetry for Node.js, preload auto-instrumentation and send traces, metrics and logs via a Collector to Tempo, Prometheus and Loki.
Uptime checks tell you a site is down; my Uptime Kuma guide covers that. They don't tell you why the orders page takes four seconds on Tuesdays. Traces do. I set up the whole stack on 11 October 2026 the way I'd run it on a client's VPS: OpenTelemetry Collector 0.162.0, Grafana Tempo 3.1.0, Prometheus 3.13.4, Loki 3.7.8 and Grafana 13.1.3 in Docker Compose, with a NestJS API querying a 1M-row PostgreSQL table, and a second Node.js service calling it. Everything below ran, including the overhead measurements and two surprises.
Key takeaways
- Zero-code instrumentation works for NestJS, HTTP, fetch, PostgreSQL and pino with one
--requireflag and a few environment variables. - One trace showed 33.4 ms of a 35.9 ms request inside one SQL query, with the SQL text attached. That's the "why".
- Instrumentation is not free. With every auto-instrumentation at 100% sampling, my test endpoint dropped from 6,860–8,811 to 4,108–4,387 requests per second. Five instrumentations and 10% sampling recovered most of it.
- The register hook changes SIGTERM behaviour. An app without its own SIGTERM handler kept running after
kill -TERM. - Grafana's all-in-one
otel-lgtmimage is for development, demos and testing, by its own README. Run the components separately in production.
The architecture
- Your Node.js apps send OTLP over HTTP to the Collector on
127.0.0.1:4318. - The Collector batches, limits memory and routes each signal: traces to Tempo, metrics to Prometheus's OTLP endpoint, logs to Loki's OTLP endpoint.
- Grafana reads all three and links them: from a trace to its logs, from a metric spike to example traces.
Docker Compose for the stack
services:
  otel-collector:
    image: otel/opentelemetry-collector-contrib:0.162.0
    command: ["--config=/etc/otelcol/config.yaml"]
    volumes:
      - ./otel-collector.yaml:/etc/otelcol/config.yaml:ro
    ports:
      - "127.0.0.1:4318:4318"   # OTLP/HTTP from apps on this server only
    restart: unless-stopped

  tempo:
    image: grafana/tempo:3.1.0
    command: ["-config.file=/etc/tempo.yaml"]
    volumes:
      - ./tempo.yaml:/etc/tempo.yaml:ro
      - tempo-data:/var/tempo
    restart: unless-stopped

  prometheus:
    image: prom/prometheus:v3.13.4
    command:
      - --config.file=/etc/prometheus/prometheus.yml
      - --web.enable-otlp-receiver
      - --storage.tsdb.retention.time=15d
    volumes:
      - prom-data:/prometheus
    restart: unless-stopped

  loki:
    image: grafana/loki:3.7.8
    volumes:
      - loki-data:/loki
    restart: unless-stopped

  grafana:
    image: grafana/grafana:13.1.3
    volumes:
      - ./grafana-datasources.yaml:/etc/grafana/provisioning/datasources/datasources.yaml:ro
      - grafana-data:/var/lib/grafana
    ports:
      - "127.0.0.1:3001:3000"   # reach it through an SSH tunnel or Nginx with auth
    restart: unless-stopped

volumes:
  tempo-data:
  prom-data:
  loki-data:
  grafana-data:
Only the Collector and Grafana publish ports, and only on 127.0.0.1. Docker-published ports skip UFW rules (see my Docker bypasses UFW fix), so binding to localhost is what keeps them private. If apps on other servers need to send data, put the Collector behind TLS and authentication rather than opening 4318 to the internet.
The Collector config
receivers:
  otlp:
    protocols:
      http:
        endpoint: 0.0.0.0:4318

processors:
  memory_limiter:
    check_interval: 1s
    limit_mib: 400
  batch: {}

exporters:
  otlp_grpc/tempo:
    endpoint: tempo:4317
    tls:
      insecure: true
  otlp_http/prometheus:
    endpoint: http://prometheus:9090/api/v1/otlp
  otlp_http/loki:
    endpoint: http://loki:3100/otlp

service:
  pipelines:
    traces:
      receivers: [otlp]
      processors: [memory_limiter, batch]
      exporters: [otlp_grpc/tempo]
    metrics:
      receivers: [otlp]
      processors: [memory_limiter, batch]
      exporters: [otlp_http/prometheus]
    logs:
      receivers: [otlp]
      processors: [memory_limiter, batch]
      exporters: [otlp_http/loki]
Most guides still use the exporter names otlp and otlphttp. They work in 0.162.0, but the Collector logged "otlphttp" alias is deprecated; use "otlp_http" instead and the same for otlp → otlp_grpc. I switched to the new names above and confirmed traces still arrived.
Tempo 3 config
server:
  http_listen_port: 3200

distributor:
  receivers:
    otlp:
      protocols:
        grpc:
          endpoint: 0.0.0.0:4317

backend_worker:
  compaction:
    block_retention: 168h   # keep traces 7 days

storage:
  trace:
    backend: local
    wal:
      path: /var/tempo/wal
    local:
      path: /var/tempo/blocks

usage_report:
  reporting_enabled: false
Tempo 3.0 removed the ingester and compactor blocks you'll find in older tutorials. In single-binary mode (the default -target=all) no Kafka is needed, and retention now lives under backend_worker.compaction.block_retention, which defaults to 336h. The Grafana data source file just points at http://tempo:3200, http://prometheus:9090 and http://loki:3100.
Instrument the Node.js app without code changes
npm i @opentelemetry/api @opentelemetry/auto-instrumentations-node

OTEL_SERVICE_NAME=orders-api \
OTEL_EXPORTER_OTLP_ENDPOINT=http://127.0.0.1:4318 \
OTEL_METRICS_EXPORTER=otlp \
OTEL_LOGS_EXPORTER=otlp \
OTEL_NODE_ENABLED_INSTRUMENTATIONS=http,undici,nestjs-core,pg,pino \
OTEL_TRACES_SAMPLER=parentbased_traceidratio \
OTEL_TRACES_SAMPLER_ARG=0.1 \
node --require @opentelemetry/auto-instrumentations-node/register dist/main.js
With PM2, put these in the env block of your ecosystem file and the flag in node_args. Next.js has its own hook for this, instrumentation.ts, described in the Next.js OpenTelemetry guide; point it at the same Collector and traces continue from the frontend server into the API.
What one trace showed
The web service called GET /reports/gift-orders on the API, which ran a LIKE '%...%' count over 1M orders. Spans from Tempo, trimmed:
web         GET                                 35.89 ms  url.path=/report
web         GET (undici, the fetch to the API)  35.06 ms  url.path=/reports/gift-orders
orders-api  GET /reports/gift-orders            34.52 ms  http.route=/reports/gift-orders
orders-api  OrdersController.report             34.11 ms
orders-api  pg-pool.connect                      0.12 ms
orders-api  pg.query:SELECT shop                33.36 ms  db.query.text=SELECT count(*)::int AS n FROM "Order" WHERE notes LIKE '%gift note gift%'
In Grafana, the TraceQL query { name =~ "pg.query.*" && duration > 20ms } found it directly. The first request after startup told a different story: pg-pool.connect took 11.4 ms for a 2.2 ms query, because the pool was opening its first connection. Fixing slow queries like this is its own topic, covered in my slow Prisma and PostgreSQL queries guide.
Metrics and logs you get for free
After the SDK's first export (every 60 seconds by default), Prometheus had http_server_request_duration_seconds, db_client_operation_duration_seconds, db_client_connection_pending_requests, nodejs_eventloop_delay_p99_seconds and V8 heap and GC metrics, enough for latency, error-rate and saturation dashboards. Pino log lines gained trace_id and span_id fields and arrived in Loki with the trace ID attached.
One side effect of sampling: requests that weren't sampled still log a trace_id, with trace_flags: "00", and that trace won't exist in Tempo. Filter on the flag, or keep 100% sampling for errors by sampling in the Collector instead.
The overhead, measured
5,000 requests, 20 at a time, against the "20 newest orders" endpoint, alternating runs. All on one machine, so these are relative numbers:
no instrumentation              6,860 - 8,811 req/s   p50 1.6 - 2.7 ms
all auto-instrumentations       4,108 - 4,387 req/s   p50 3.6 - 3.8 ms
5 instrumentations              5,099 - 5,115 req/s   p50 2.9 - 3.0 ms
5 instrumentations + 10% sample 5,373 - 5,637 req/s   p50 2.8 ms
The default set instruments everything it finds, including every Express middleware and TCP socket. Enable only what you'll look at with OTEL_NODE_ENABLED_INSTRUMENTATIONS, and sample traces once traffic grows. Under normal load an extra millisecond won't matter; at full CPU, losing 40 to 50% of throughput does. The stack itself used about 390 MiB of RAM under my light test load: Grafana 185 MiB, Tempo 67, Loki 58, Collector 40 and Prometheus 38. Budget more for real retention.
Two production gotchas
- SIGTERM. The
registerfile addsprocess.on('SIGTERM', shutdown)to flush telemetry. Adding any SIGTERM listener disables Node's default exit, so the instrumented build of my test API kept listening afterkill -TERM, while the same code without the hook exited. Docker and systemd send SIGTERM and wait before killing, so deploys get slow. Handle SIGTERM in your app (NestJS:app.enableShutdownHooks()). PM2 sends SIGINT by default, which still exits. - SQL text in spans. The pg instrumentation records the query text. With parameters (
$1) only placeholders are stored; values concatenated into SQL, like emails, end up in your traces.
Frequently asked questions
Can I self-host OpenTelemetry for free?
Yes. The Collector, Tempo, Prometheus, Loki and Grafana are open source and run on your own server. You pay in server resources and maintenance: disk for retention, RAM for the stack and time for upgrades.
How much server do I need for Node.js observability?
The stack idled at about 390 MiB of RAM in my test, so a 2 GB VPS can run it next to a small app, and 4 GB is more comfortable. Disk depends on traffic, sampling and retention; start with 7 days of traces and 15 days of metrics and watch volume growth.
Does OpenTelemetry slow down my Node.js app?
Measurably at full load: in my test, all auto-instrumentations at 100% sampling cut peak throughput by 40 to 50%. Limiting instrumentations and sampling 10% of traces brought most of it back. Measure on your own endpoints.
Can I use grafana/otel-lgtm in production?
Its README says it's intended for development, demo and testing environments. It's great for trying things locally; for production run the components separately, as in this Compose file.
Do I still need uptime monitoring with OpenTelemetry?
Yes. Telemetry comes from inside your app, so if the app or server is down there is nothing to send. An external uptime check catches that, and traces explain the slowdowns while it's up.
Want this running on your servers?
I set up self-hosted monitoring for Node.js and PostgreSQL apps: traces, dashboards and alerts that point at the cause, tuned so they don't slow production down. See my DevOps services or tell me what you can't see today.

Written by
MD Rakibul Islam Rakib
Full-stack developer, DevOps engineer and Linux system administrator with 5+ years of production experience. I deploy, harden and fix servers and web apps for clients worldwide, and everything in this article runs on real servers I manage, including this site.
- OpenTelemetry Node.js self hosted monitoring
- Node.js distributed tracing
- OpenTelemetry Docker Compose
- self hosted application monitoring
- NestJS observability
- Grafana Tempo
- OpenTelemetry Collector