Fix Slow Prisma Queries with PostgreSQL EXPLAIN ANALYZE
 MD Rakibul Islam RakibFull-stack developer, DevOps & Linux engineer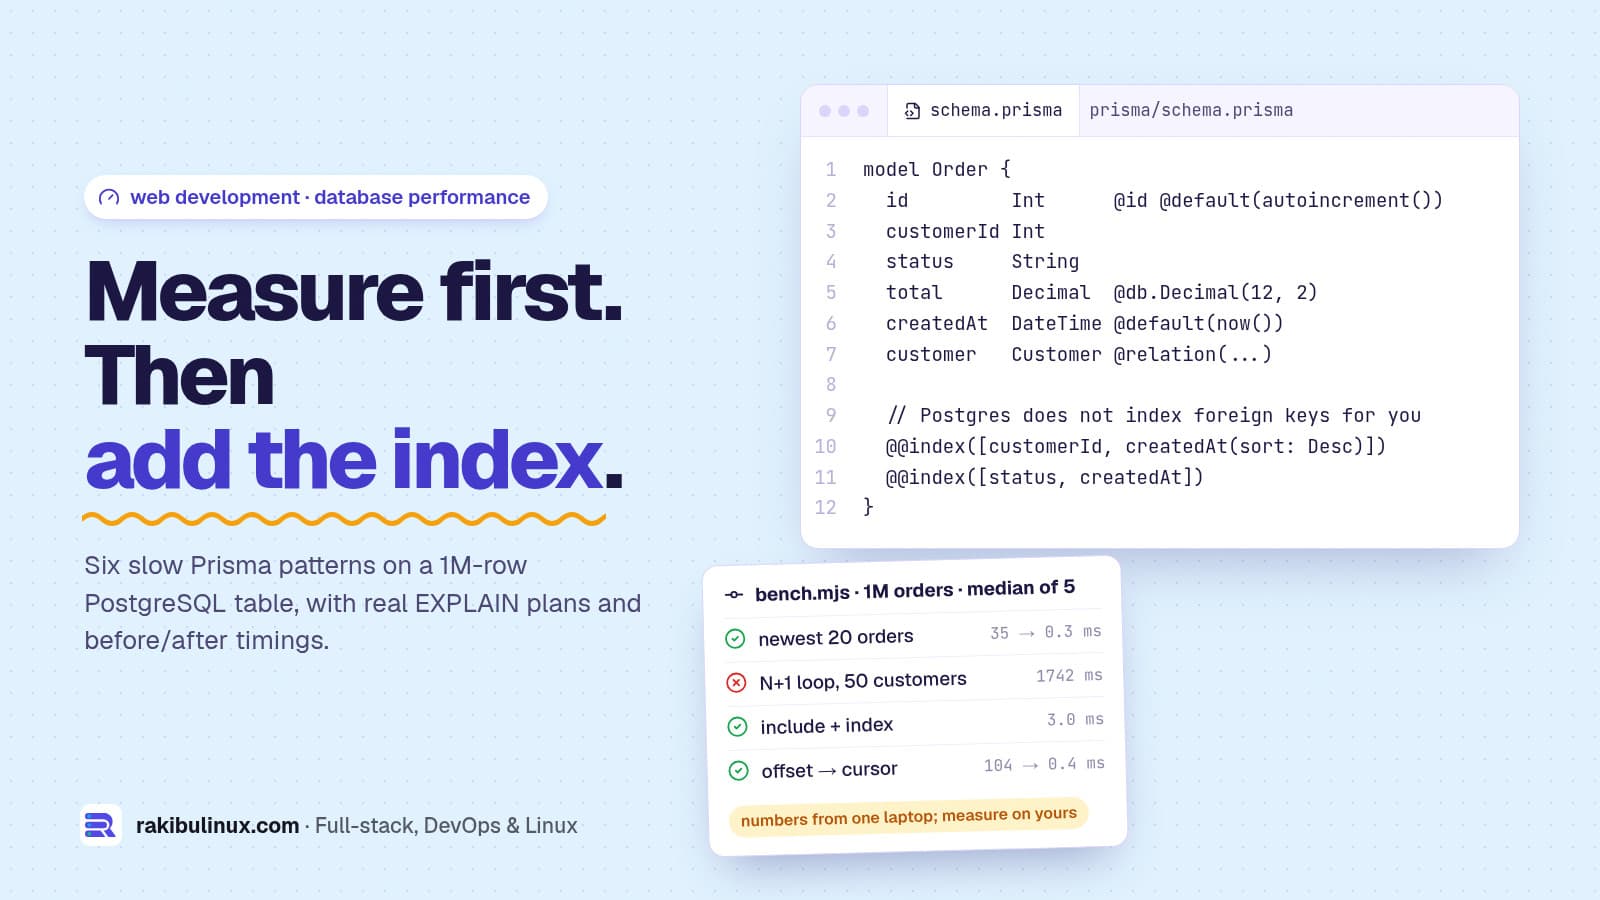
To fix slow Prisma queries, log the SQL Prisma sends, run EXPLAIN ANALYZE on it, then add the missing index, remove the N+1 loop or use cursor paging.
The API behind this website runs on NestJS, Prisma 7 and PostgreSQL, and so do most backends I build for clients. Slow pages almost never need a bigger server. They need one of a handful of fixes, and the only way to pick the right one is to measure.
So I built a test database with 20,000 customers and 1,000,000 orders (580 MB), ran six common Prisma patterns on Prisma 7.10 and PostgreSQL 18.6 on 11 October 2026, and recorded the median of five runs before and after each fix. The numbers come from one laptop with the database in Docker. Yours will differ, but the ratios are what matter.
Key takeaways
- PostgreSQL doesn't index foreign keys for you, and neither did
prisma migrate. Awhere: { customerId }on a big table is a full scan until you add@@index. - One missing index made one query read 559 MB of pages. After the index it read 23 pages and went from 35 ms to 0.3 ms.
- N+1 loops multiply everything. 51 queries took 1,742 ms; one
includetook 43 ms, and 3 ms with the index. - Turning on
relationJoinswithout the index madeinclude50 times slower. Measure after every "optimisation". - Deep
skippages are slow by design. Offset 500,000 took 104 ms; a cursor took 0.4 ms.
Step 1: see the SQL Prisma actually sends
const prisma = new PrismaClient({
  adapter: new PrismaPg({ connectionString: process.env.DATABASE_URL }),
  log: [{ emit: 'event', level: 'query' }],
});

prisma.$on('query', (e) => {
  if (e.duration > 100) console.warn(`${e.duration} ms`, e.query, e.params);
});
That prints every query slower than 100 ms with its parameters, which you can paste into psql after EXPLAIN (ANALYZE, BUFFERS). On a production database also enable the pg_stat_statements extension, which ranks queries by total time across all requests, and set log_min_duration_statement so PostgreSQL itself logs slow statements.
Problem 1: a missing index on the foreign key
The query behind a "recent orders" panel:
prisma.order.findMany({ where: { customerId: 4242 }, orderBy: { createdAt: 'desc' }, take: 20 });
The migration Prisma generated had a unique index on Customer.email and nothing on Order.customerId. The plan, trimmed:
Limit  (actual time=33.491..34.832 rows=20.00 loops=1)
  Buffers: shared hit=16016 read=55487
  ->  Gather Merge
        ->  Sort  Sort Key: "createdAt" DESC
              ->  Parallel Seq Scan on "Order"
                    Filter: ("customerId" = 4242)
                    Rows Removed by Filter: 333316
Execution Time: 34.852 ms
35 ms sounds harmless. The Buffers line is the real cost: 71,503 pages of 8 KB, about 559 MB, read for 20 rows. Under real traffic every such request competes for disk and cache, and it gets slower as the table grows. The fix is a composite index that matches both the filter and the sort:
model Order {
  // ...
  @@index([customerId, createdAt(sort: Desc)])
  @@index([status, createdAt])
}
Index Scan using "Order_customerId_createdAt_idx" on "Order"
  Index Cond: ("customerId" = 4242)
Buffers: shared hit=5 read=18
Execution Time: 0.176 ms
From 71,503 pages to 23. The second index served the dashboard's "paid revenue in the last 30 days" query, which went from a parallel seq scan at 36.5 ms to a bitmap index scan at 6.7 ms.
Problem 2: the N+1 loop
// 51 queries: one for customers, one per customer
const customers = await prisma.customer.findMany({ take: 50 });
for (const c of customers)
  c.orders = await prisma.order.findMany({ where: { customerId: c.id }, orderBy: { createdAt: 'desc' }, take: 5 });

// 1-2 queries
const customers = await prisma.customer.findMany({
  take: 50,
  include: { orders: { orderBy: { createdAt: 'desc' }, take: 5 } },
});
Results on the 1M-row table:
- N+1 loop, no index: 1,742 ms, 51 queries. Fifty full scans.
include, no index: 43 ms, 2 queries.- N+1 loop with the index: 20.7 ms. Still 51 round trips, which hurts more when the database is on another server.
includewith the index: 3.0 ms.
One surprise in the SQL log: by default, Prisma 7.10 loads the relation with WHERE "customerId" IN (...) and no LIMIT, then applies take: 5 in memory. For these 50 customers it fetched 2,466 orders to return 250. With customers who have thousands of orders each, that is a lot of wasted rows.
Problem 3: relationJoins without an index
Prisma 7.10 still has database-level joins behind the relationJoins preview feature. With it enabled, include becomes one query with a LEFT JOIN LATERAL ... LIMIT per customer, so only 5 orders per customer are read. That sounds strictly better, but without the index each of the 50 lateral subqueries scanned the table: the same include went from 43 ms to 2,195 ms. With the index it was the fastest option at 2.2 ms. Same feature, opposite results, and only measuring tells you which one you have.
Problem 4: over-fetching columns
Each order row carries a 500-character notes field. Fetching 1,000 orders with every column returned 576 KB of JSON in 4.8 ms; selecting only id, status, total and createdAt returned 82 KB in 3.0 ms. The database time hardly changes, but seven times less data crosses the network, gets parsed by Node.js and goes to the browser. Use select for lists, and load the full record on the detail page.
Problem 5: deep offset pagination
// page 25,001: PostgreSQL walks 500,000 index entries and throws them away
prisma.order.findMany({ orderBy: { id: 'asc' }, skip: 500000, take: 20 });   // 104 ms

// cursor: start right after the last row the client saw
prisma.order.findMany({ orderBy: { id: 'asc' }, cursor: { id: 500000 }, skip: 1, take: 20 });   // 0.4 ms
The offset plan was an index scan that produced 500,020 rows to return 20. It gets slower with every page. Cursor pagination costs the same on page 1 and page 25,000. Use it for infinite scroll, APIs and exports; offset is fine for the first few pages of an admin table.
Problem 6: waiting for a connection, not the database
Prisma 7 uses a driver adapter, and with @prisma/adapter-pg the pool belongs to node-postgres, whose default max is 10 connections. I fired 100 concurrent queries that each take 50 ms:
default pool                             528 ms for 100 x 50 ms queries
max: 25                                  246 ms for 100 x 50 ms queries
?connection_limit=25 in URL              530 ms for 100 x 50 ms queries
With 10 connections, requests queue in your app even though PostgreSQL is idle. Note the last line: the old connection_limit URL parameter had no effect with the adapter. Set the size in code, new PrismaPg({ connectionString, max: 25 }), and keep the total across all app instances below PostgreSQL's max_connections, or you trade this problem for "too many clients already".
Adding indexes to a live table
A plain CREATE INDEX blocks writes to the table until it finishes. My whole migration with two indexes on 1M rows took under 2 seconds; on a table with hundreds of millions of rows it can take many minutes. Generate the migration with prisma migrate dev --create-only, change it to CREATE INDEX CONCURRENTLY, and deploy.
I checked that prisma migrate deploy on 7.10 applies such a migration, even with two concurrent index statements in one file. If a concurrent build fails, PostgreSQL leaves an invalid index behind: find it with SELECT indexrelid::regclass FROM pg_index WHERE NOT indisvalid, drop it and retry. My Prisma 7 config guide covers the prisma.config.ts setup these commands rely on.
Frequently asked questions
Why is my Prisma query slow when the same SQL is fast in psql?
Check three things: whether psql used the same parameter values, whether your app is waiting for a pool connection rather than the database, and how much data comes back. Over-fetching large columns and queueing for a connection both look like "slow Prisma" from the outside.
Does Prisma create indexes for foreign keys?
Not in my test. prisma migrate created the foreign key constraint and a unique index for @unique, but no index on customerId. PostgreSQL doesn't add one automatically either, so add @@index for every relation you filter or join on.
Should I enable relationJoins?
Only after the related columns are indexed, and only after measuring your real queries. In my test it was the fastest option with an index and 50 times slower without one. It is still a preview feature in Prisma 7.10.
How do I read EXPLAIN ANALYZE output?
Look for Seq Scan on large tables, a large Rows Removed by Filter, a big gap between estimated and actual rows, and the Buffers numbers. Those four point to a missing index, stale statistics or a query that reads far more than it returns.
Is cursor pagination always better than skip and take?
For deep pages and infinite scroll, yes. It can't jump to "page 37" directly, so admin screens with numbered pages often keep offset paging for the first pages and add filters instead of letting users page through millions of rows.
Is your app getting slower as it grows?
I profile Node.js and PostgreSQL backends, find the queries that matter and fix them with measured before-and-after results, no rewrite needed. See my web development services or send me your slowest page.

Written by
MD Rakibul Islam Rakib
Full-stack developer, DevOps engineer and Linux system administrator with 5+ years of production experience. I deploy, harden and fix servers and web apps for clients worldwide, and everything in this article runs on real servers I manage, including this site.
- Prisma PostgreSQL query optimization
- Prisma slow queries
- PostgreSQL EXPLAIN ANALYZE
- Prisma N+1 query fix
- Prisma index
- cursor pagination Prisma
- Node.js database performance