Skip to content
All articles
7 min read

SSH Permission Denied (publickey)? How to Fix It

MD Rakibul Islam RakibMD Rakibul Islam RakibFull-stack developer, DevOps & Linux engineer
SSH Permission Denied (publickey)? How to Fix It

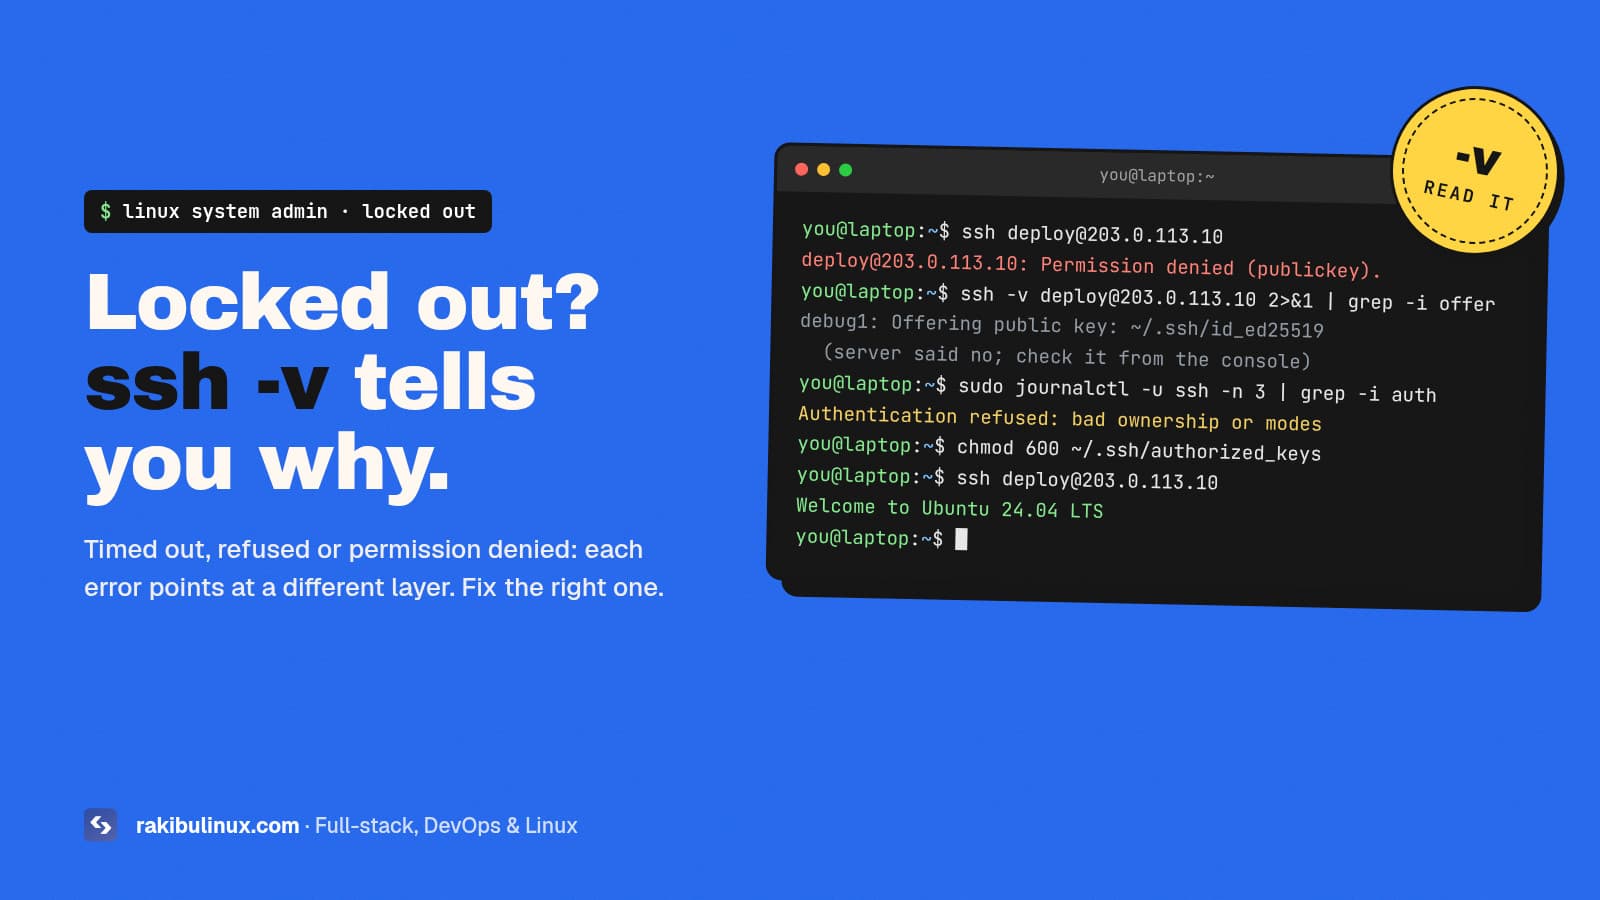
"Permission denied (publickey)" means SSH reached your server but it rejected your key. Run ssh -v to see which key was offered, then check authorized_keys.

Getting locked out of your own server is stressful, especially when a site is down and you need to get in now. The good news: SSH errors are precise. "Connection timed out", "Connection refused" and "Permission denied" each point at a different layer, and the server's auth log tells you exactly why it said no. This is the order I work through on my own Ubuntu servers and on client boxes where someone changed a firewall rule or a permission and lost access.

Key takeaways

  • Read the exact error first. Timed out = network or firewall. Refused = nothing listening on that port. Permission denied = sshd is running but rejected your login.
  • ssh -v shows which keys your client offered and where the handshake stopped. It's the fastest single check.
  • The server's log says why it refused: sudo journalctl -u ssh on Ubuntu. "Bad ownership or modes" is the classic.
  • Permissions matter: ~/.ssh must be 700 and authorized_keys 600, owned by the user, or sshd ignores them.
  • Fully locked out? Use your VPS provider's web or serial console. It works without SSH.

Which SSH error do you have?

Run the connection with verbose output and look at the last lines:

ssh -v deploy@203.0.113.10
# more detail if you need it:
ssh -vvv deploy@203.0.113.10
  • Connection timed out: packets never got an answer. Wrong IP, server down, or a firewall (UFW, the provider's cloud firewall, a security group) dropping port 22.
  • Connection refused: the server answered "nothing here". sshd isn't running, it listens on another port, or Fail2ban rejects your IP.
  • Permission denied (publickey): you reached sshd and authentication failed. This is the most common one and the rest of this guide covers it in detail.
  • Host key verification failed or "REMOTE HOST IDENTIFICATION HAS CHANGED": the server's identity differs from what your laptop remembers. Normal after a rebuild; suspicious if nothing changed.
you 1. networkfirewall, IP 2. sshd :22running? 3. authkey accepted? timed out refused permission denied The error tells you which gate stopped you.
An SSH login passes three gates in order. "Timed out" fails at the network, "refused" means sshd isn't listening, and "permission denied" means you got all the way to authentication and the key was rejected.

Fix "Permission denied (publickey)"

1. Check which key your client offers

ssh -v deploy@203.0.113.10 2>&1 | grep -E 'Offering|Authenticated|denied'

If the key you expect isn't in the "Offering public key" lines, point at it explicitly: ssh -i ~/.ssh/id_ed25519 -o IdentitiesOnly=yes deploy@203.0.113.10. IdentitiesOnly also fixes "Too many authentication failures", which happens when your SSH agent offers five wrong keys before the right one and the server gives up.

Also check the username. Many cloud images only accept ubuntu, debian or root for the first login, and a key added to deploy's account won't work for root.

2. Get in another way and read the server's log

Use the provider's browser console (Hetzner, DigitalOcean, Hostinger, AWS and others all have one) or another user that still works. Then:

sudo journalctl -u ssh -n 50 --no-pager      # Ubuntu / Debian
sudo journalctl -u sshd -n 50 --no-pager     # RHEL, Rocky, Alma
sudo tail -n 50 /var/log/auth.log            # older setups

The log line usually names the problem: bad permissions, an unknown user, a key type that isn't allowed, or a user not in AllowUsers.

3. Fix permissions and ownership

sshd's StrictModes (on by default) refuses keys when the home directory, ~/.ssh or authorized_keys is writable by anyone else. This is the cause I see most after someone ran chmod -R 777 or copied files as root:

sudo chown -R deploy:deploy /home/deploy/.ssh
sudo chmod 755 /home/deploy          # or 750; never group/world-writable
sudo chmod 700 /home/deploy/.ssh
sudo chmod 600 /home/deploy/.ssh/authorized_keys

4. Check the key is actually in authorized_keys

Each key must be one line, starting with its type (ssh-ed25519, ssh-rsa, ecdsa-sha2-…). Pasting into a web console often breaks the line or adds smart quotes. Compare fingerprints on both sides:

# on your laptop
ssh-keygen -lf ~/.ssh/id_ed25519.pub
# on the server
ssh-keygen -lf /home/deploy/.ssh/authorized_keys

If the server is old and you use a new key type, or the server is new and your key is an old ssh-rsa one, the algorithm can be refused. OpenSSH 8.8 and later disable RSA signatures with SHA-1 by default. The clean fix is a new Ed25519 key: ssh-keygen -t ed25519.

5. Check sshd's effective config

sudo sshd -T | grep -E 'pubkeyauthentication|passwordauthentication|permitrootlogin|allowusers|authorizedkeysfile'

sshd -T prints the settings sshd actually uses, including files in /etc/ssh/sshd_config.d/, where cloud images drop overrides such as 50-cloud-init.conf. Look for PermitRootLogin no when you log in as root, an AllowUsers line that leaves you out, or a custom AuthorizedKeysFile. Always test before restarting: sudo sshd -t must print nothing.

Fix "Connection refused"

sudo systemctl status ssh
sudo ss -tlnp | grep ssh
sudo fail2ban-client status sshd          # if Fail2ban is installed
  • sshd not running: sudo sshd -t shows the config error that stopped it. Fix it, then sudo systemctl restart ssh.
  • Different port: connect with ssh -p 2222 …. On Ubuntu 24.04, sshd is socket-activated: after changing Port you must run sudo systemctl daemon-reload and sudo systemctl restart ssh.socket, or it keeps listening on the old port. That trips up a lot of people following older guides.
  • Banned by Fail2ban after a few failed attempts: sudo fail2ban-client set sshd unbanip YOUR.IP.

Fix "Connection timed out"

Check the server is up in your provider's panel, then the firewalls. There are often two: UFW on the server and a cloud firewall in the provider's dashboard. Both must allow your SSH port. If you changed the SSH port, allow the new one before removing 22:

sudo ufw allow 2222/tcp
sudo ufw status numbered

How to never get locked out again

  • Keep a second session open while you change sshd or firewall settings, and test a new login before closing it.
  • Have two keys in authorized_keys (laptop and a backup) and a sudo user besides root.
  • Know where your provider's console is before you need it.
  • Harden in the right order: keys work first, then disable passwords. My Ubuntu 24.04 hardening checklist does it step by step.

And if the host key changed when you didn't rebuild anything, or you see logins you don't recognise in the auth log, stop and read what to do if your server was hacked. If you got in but the site still isn't loading, the website down checklist is the next step.

Frequently asked questions

What does "Permission denied (publickey)" mean?

Your client reached the SSH server, but none of the keys it offered was accepted for that user, and password login is disabled. The usual causes are the wrong key or username, a missing or broken line in authorized_keys, or permissions on ~/.ssh that are too open.

What permissions should ~/.ssh and authorized_keys have?

The ~/.ssh directory should be 700 and authorized_keys 600, both owned by the user. The home directory must not be writable by group or others, or sshd ignores the keys.

How do I get into my server if SSH is completely broken?

Use your hosting provider's web console, VNC or serial console, which connects like a physical screen and doesn't depend on SSH. Some providers also offer a rescue mode that boots a separate system so you can fix files on the disk.

Why does SSH still use port 22 after I changed it on Ubuntu 24.04?

Ubuntu 24.04 starts sshd through a systemd socket, which reads the port when systemd reloads. Run sudo systemctl daemon-reload and then sudo systemctl restart ssh.socket after editing the Port setting.

Is "REMOTE HOST IDENTIFICATION HAS CHANGED" dangerous?

It's expected after you reinstall or rebuild a server; remove the old entry with ssh-keygen -R and the IP or hostname. If nothing was rebuilt, treat it as a warning sign and verify the new host key through the provider's console before connecting.

Locked out of your server right now?

I recover access to locked-out Linux servers, then set up keys, firewall and console access so it doesn't happen again. See my Linux system admin services or contact me now with the exact SSH error and your provider's name.

MD Rakibul Islam Rakib

Written by

MD Rakibul Islam Rakib

Full-stack developer, DevOps engineer and Linux system administrator with 5+ years of production experience. I deploy, harden and fix servers and web apps for clients worldwide, and everything in this article runs on real servers I manage, including this site.

  • SSH permission denied publickey
  • SSH connection refused
  • locked out of server
  • authorized_keys permissions
  • sshd
  • Ubuntu 24.04
  • Linux server

Keep reading

Crawled - Currently Not Indexed: How to Fix It
Website DesignOct 6, 2026

Crawled - Currently Not Indexed: How to Fix It

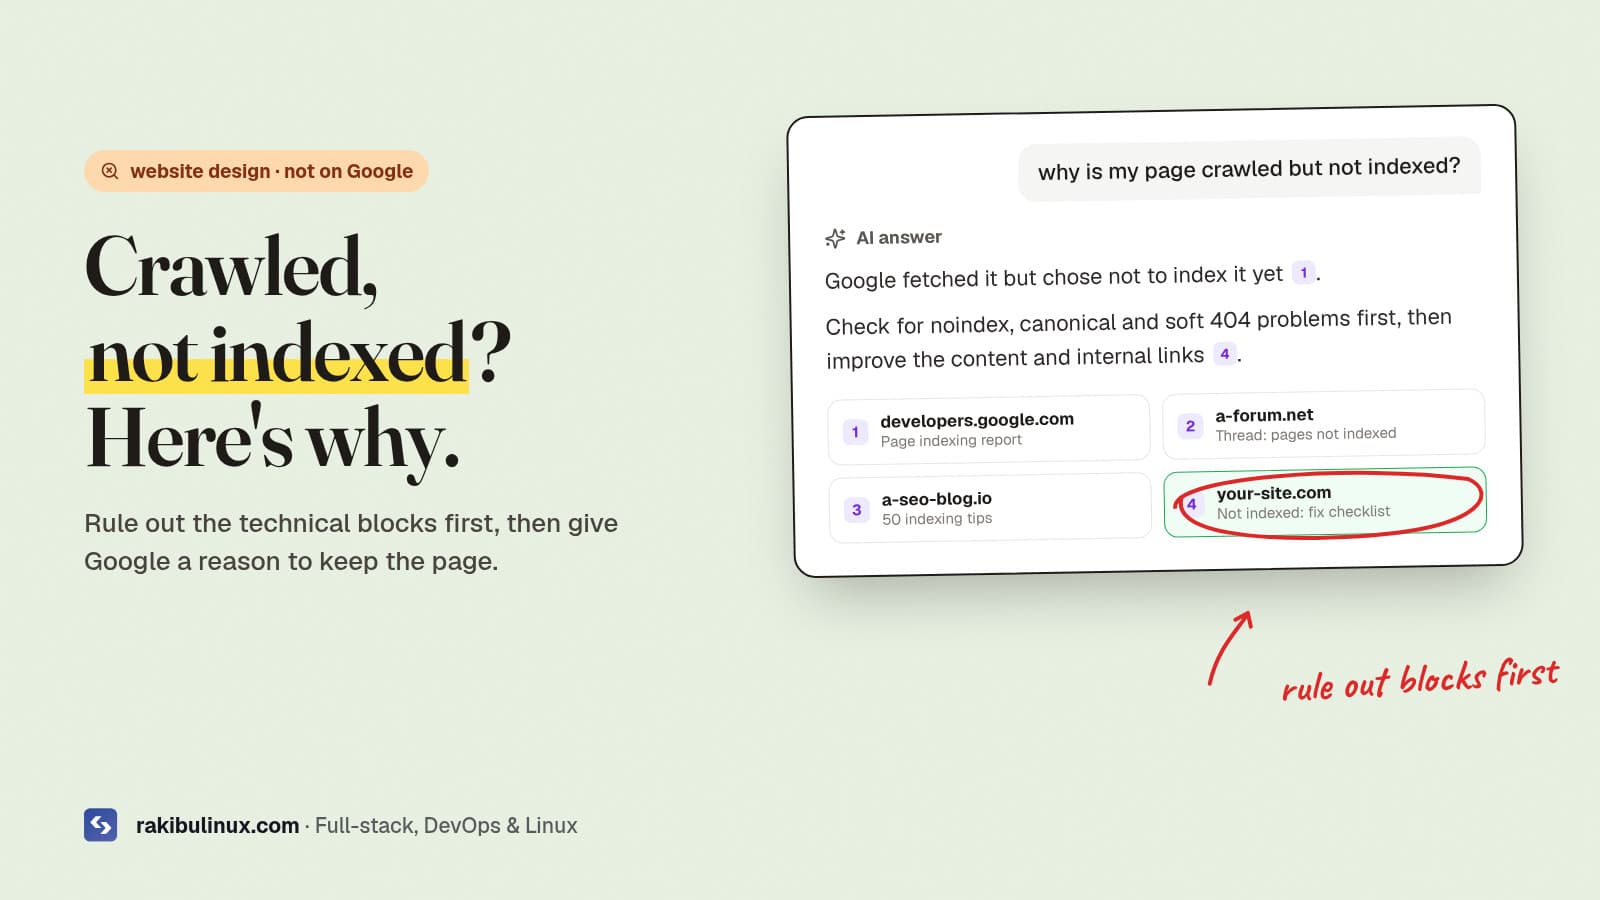
"Crawled - currently not indexed" means Google fetched your page but chose not to index it. Rule out noindex, canonical and soft 404 issues, then improve it. You published the page, submitted the sitemap, waited, and Search Console still lists it under "Why pages aren't indexed". For a business site that means the service page or article you're counting on gets zero search traffic. The two statuses people hit most, "Crawled - currently not indexed" and "Discovered - currently not indexed", have different causes and different fixes. I went through this on this website: a stray canonical tag in the root layout was quietly pointing pages like Privacy and Terms at the homepage, and the canonical URL used the non-www domain that redirects. Here's the checklist I now use, technical blocks first, quality second. Key takeaways "Discovered" = not crawled yet. Google knows the URL but hasn't fetched it, often because it looks low priority or the server is slow. "Crawled" = fetched and not kept. Usually a quality or duplication judgement, but rule out technical causes first. Use URL Inspection's live test on one affected page. It shows the canonical Google chose, any noindex, and the HTML Google actually rendered. Internal links are the strongest lever you control: link to the page from your homepage, service pages and related posts. Request indexing once, after a real fix. Re-requesting an unchanged page doesn't help. What the two statuses mean According to Google's Page indexing report help , "Crawled - currently not indexed" means the page was crawled but not indexed, and it may or may not be indexed later. "Discovered - currently not indexed" means Google found the URL but postponed crawling it, typically to avoid overloading the site. Neither is an error in the technical sense. They're Google saying "not yet" or "not worth it". Your job is to remove any reason that's your fault and make the page clearly worth indexing. Pages move from discovered to crawled to indexed. "Discovered - currently not indexed" stops before Google fetches the page; "Crawled - currently not indexed" stops after the fetch, when Google decides whether to keep it. Only indexed pages can appear in results. Step 1: Inspect one affected URL In Search Console, paste the URL into the top search bar (URL Inspection), then click Test live URL . Check: Indexing allowed? If it says no, there's a noindex in a meta tag or an X-Robots-Tag header. User-declared vs Google-selected canonical. If they differ, Google thinks another URL is the main version. View tested page → HTML. Is your main content in the HTML Google rendered? If it's empty or a loading spinner, JavaScript rendering is the problem. Page fetch and HTTP status: must be successful with a 200. From a terminal you can check the same signals quickly: curl -sI https://www.example.com/services/web-design | grep -i -E '^HTTP|x-robots-tag|location' curl -s https://www.example.com/services/web-design | grep -o -i -E '<link rel="canonical"[^>]*>|<meta name="robots"[^>]*>' Step 2: Fix the technical causes Wrong canonical The most common one I find, and the one that hit this site. A canonical set once in a shared layout or theme makes every page point at the homepage, so Google treats them as duplicates. Each page should declare its own full, final URL as canonical: correct protocol, correct www or non-www, no redirect. If the canonical points at a URL that redirects, fix it to the destination. Accidental noindex Staging settings copied to production, a CMS checkbox ("discourage search engines"), or an SEO plugin rule on a category. Remove it, then request indexing. Soft 404 and thin pages Pages that return 200 but say "no results", "coming soon" or have a few lines of text look like empty pages. Real missing pages should return 404; thin pages need real content or should be merged. Content only visible after JavaScript If the HTML Google receives is an empty shell, indexing is slower and less reliable. Render important pages on the server. Next.js server components and static generation do this by default. Duplicate URLs The same content at ?page=1 , with tracking parameters, with and without a trailing slash, or under both http and https. Pick one, redirect or canonicalise the rest, and only list the main URL in the sitemap. Step 3: Give Google a reason to index it If the technical checks pass and it's still "Crawled - currently not indexed", Google doesn't see enough value yet. What moves it: Answer the query in the first paragraph and cover it more completely than the pages already ranking. The same structure gets pages quoted by AI answers; see how to get cited by ChatGPT and AI Overviews . Add first-hand detail: your real process, prices you can stand behind, screenshots, the problems you actually solved. That's what generic pages lack. Merge near-duplicates. Five thin location or service pages with swapped city names are weaker than one strong page. Link to it internally from the homepage, the relevant service page and related articles, with descriptive anchor text. An orphan page tells Google it isn't important to you either. Step 4: For "Discovered", make crawling easier Speed up the server. Google slows crawling when responses are slow or error out. A slow TTFB on a cheap host or an overloaded VPS shows up here. Cut low-value URLs: filter and sort parameters, tag pages, internal search results. Block or noindex them so crawl attention goes to pages that matter. Keep the sitemap clean: only canonical, indexable, 200-status URLs, with accurate lastmod dates. Link from pages that are already crawled often, such as the homepage and blog index. Step 5: Request indexing and validate After a real change, use Request indexing in URL Inspection for the most important pages (there's a daily limit, so prioritise). For a fix that affects many URLs, open the issue in the Page indexing report and click Validate fix . Google's help says validation typically takes up to about two weeks. For Bing, which also feeds ChatGPT search, submit changed URLs through IndexNow; this site pings it automatically after every publish. Lots of pages dropping out at once, or the whole site missing, is a different problem: start with the website down checklist to rule out outages, robots.txt and server errors. If your site was built on a drag-and-drop builder and you're fighting its SEO limits, my comparison of AI website builders vs a custom site may help you decide what to do next. Frequently asked questions How long does it take for "Crawled - currently not indexed" to resolve? There's no fixed time. Some pages are indexed within days of improvements and internal links; others never are if Google keeps judging them low value. If nothing changes after a few weeks, improve or merge the page rather than waiting. What's the difference between "Discovered" and "Crawled - currently not indexed"? Discovered means Google knows the URL but hasn't fetched it yet. Crawled means Google fetched it and decided not to index it for now. The first is usually about crawl priority and server speed, the second about duplication or content quality. Does requesting indexing again help? Not for an unchanged page. Request indexing once after you've fixed something or substantially improved the content, then give Google time to re-evaluate. Can a wrong canonical tag stop pages being indexed? Yes. If a page's canonical points to another URL, Google may treat it as a duplicate and index only the other one. Every page should point its canonical at its own final URL unless it really is a duplicate. Should I delete pages that aren't indexed? Delete or merge pages that have no value for visitors, such as empty tag pages or near-duplicate service pages. Pages that matter for your business should be improved and linked, not deleted. Your key pages still not on Google? I audit and fix the technical SEO of business websites, from canonicals and rendering to internal links and page content, and build sites that get indexed and cited from day one. See my website design services or contact me with your domain and a screenshot of the Page indexing report.

Read article →
Postgres "Too Many Clients Already": How to Fix It
Web DevelopmentOct 6, 2026

Postgres "Too Many Clients Already": How to Fix It

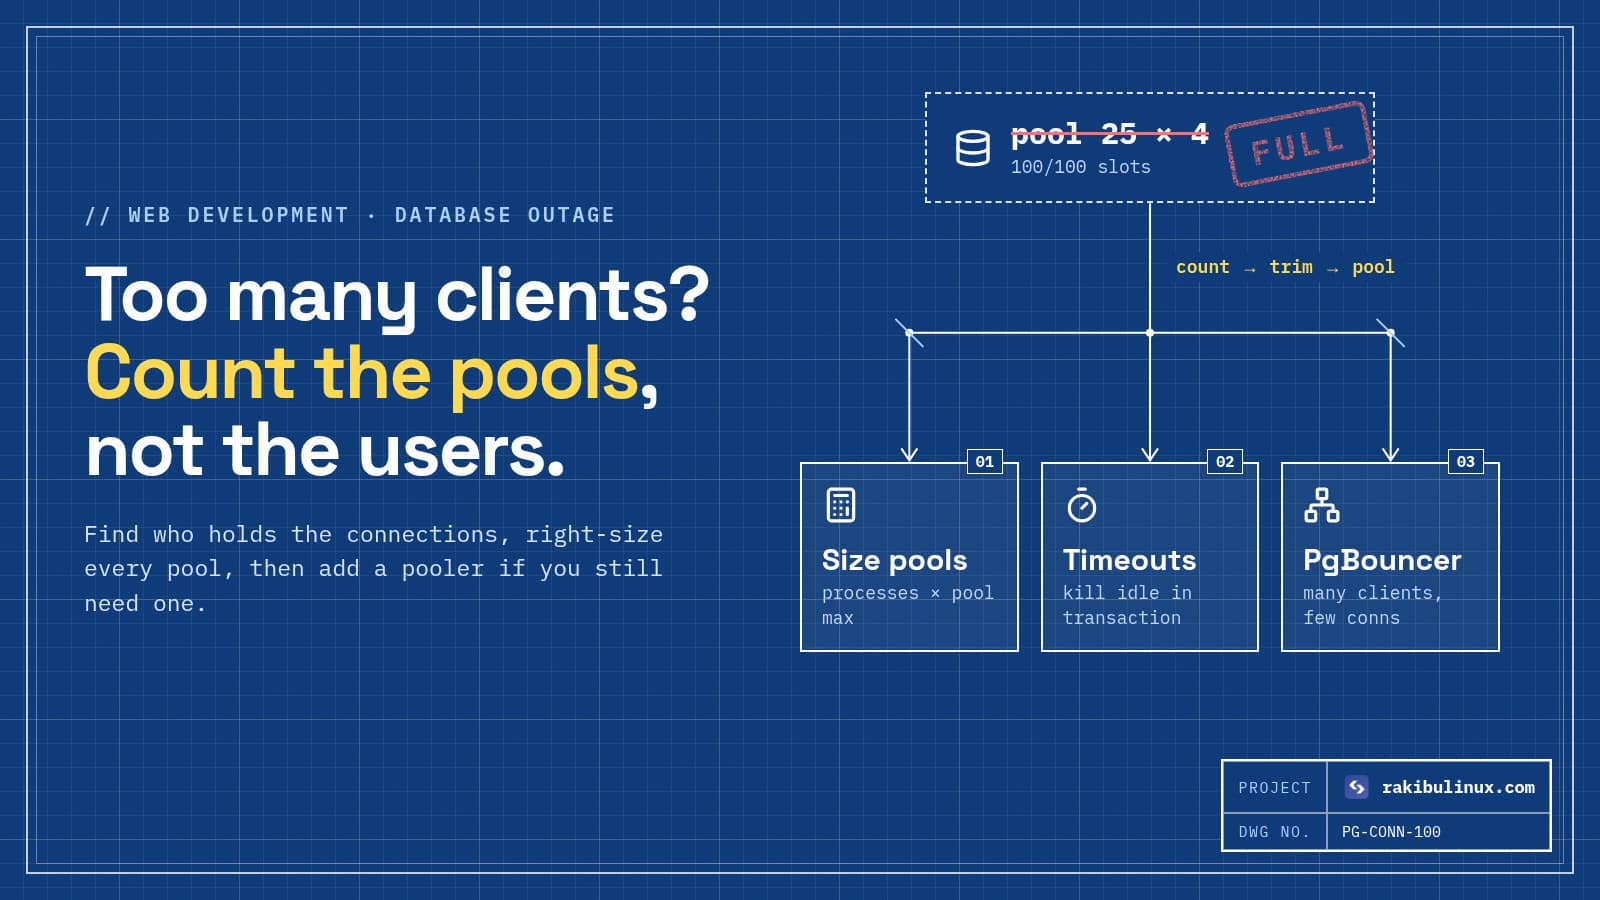
"Too many clients already" means Postgres hit max_connections. Find who holds connections in pg_stat_activity, shrink app pools, and only then raise the limit. The error usually arrives all at once: the API starts failing every request with FATAL: sorry, too many clients already , or remaining connection slots are reserved for roles with the SUPERUSER attribute on Postgres 16 and later. Restarting the app makes it go away for a while, then it's back. It's almost never "too many users". It's too many connection pools, each holding more connections than you think. My own API runs NestJS with Prisma 7 and Postgres, so the Node examples below are the ones I actually use. Key takeaways Count connections, don't guess: pg_stat_activity shows who holds each one and whether it's active, idle or stuck "idle in transaction". Do the math: total connections = app processes × pool size + workers + cron jobs + your admin tools. PM2 cluster mode and replicas multiply it. Prisma 7 with driver adapters defaults to 10 connections per client; Prisma 6 defaulted to CPU cores × 2 + 1. Set it explicitly. Kill stuck sessions with timeouts ( idle_in_transaction_session_timeout ) instead of by hand every night. Raise max_connections last. Each connection costs memory. A pooler like PgBouncer scales better. Step 1: Get in and see who holds the connections Postgres keeps a few slots ( superuser_reserved_connections , 3 by default) for superusers exactly for this moment. Connect as one: sudo -u postgres psql # in Docker: docker exec -it db psql -U postgres SHOW max_connections; SELECT count(*) FROM pg_stat_activity; SELECT usename, application_name, client_addr, state, count(*) FROM pg_stat_activity WHERE backend_type = 'client backend' GROUP BY 1, 2, 3, 4 ORDER BY 5 DESC; This tells you which user, app and host hold the slots and in what state: Mostly idle from one app: pools that are too big, or too many processes each with their own pool. idle in transaction : code that opened a transaction and never committed or rolled back. These hold locks too and are the most dangerous. Many active : slow queries piling up. More connections won't help; faster queries will. Step 2: Free slots right now To get the site back while you fix the cause, end sessions stuck in a transaction for more than a few minutes: SELECT pg_terminate_backend(pid), now() - state_change AS stuck_for, left(query, 60) FROM pg_stat_activity WHERE state = 'idle in transaction' AND now() - state_change > interval '5 minutes'; Restarting the app also releases its connections. Both are first aid; the next steps stop it coming back. Four app processes with a pool of 25 each fill all 100 slots. The last few are reserved for superusers, so the next connection from the app, a cron job or a migration is refused. The fix is smaller pools, not more slots. Step 3: Do the connection math Write it down for every client of the database: API: 4 PM2 cluster instances × pool 10 = 40 Workers: 2 queue workers × pool 10 = 20 Next.js: 2 instances × pool 10 = 20 Cron jobs, migrations, admin tools ~ 10 total ~ 90 (of 97 usable) This is how a small site hits 100 without much traffic. The usual multipliers: PM2 cluster mode, Docker replicas and Kubernetes pods: every process has its own pool. Serverless functions: each concurrent function instance can open its own connections. Use a pooler or your provider's pooled connection string. Creating a new client per request instead of one shared client per process. Each new client opens a new pool. Hot reload in development: every reload creates another client unless you keep one on globalThis . Step 4: Set pool sizes explicitly Prisma 7 (driver adapters) In Prisma 7 the pool belongs to the driver. With @prisma/adapter-pg it's a pg pool, default 10 connections per client: import { PrismaClient } from "@prisma/client"; import { PrismaPg } from "@prisma/adapter-pg"; const adapter = new PrismaPg({ connectionString: process.env.DATABASE_URL, max: 5, // per process; multiply by your instance count }); export const prisma = new PrismaClient({ adapter }); Prisma 6 and earlier The pool was built into the query engine and sized from CPU cores. Set it in the URL: postgresql://…/app?connection_limit=5 . Upgrading from 6 to 7 changes the default, so check this after the upgrade. node-postgres, TypeORM, Sequelize, Knex All have a pool max option. The pg default is 10. Create one pool per process at startup and reuse it everywhere. A good starting point: keep the total of all pools under about 80% of max_connections , leaving room for migrations, backups and you. Step 5: Add timeouts so leaks clean themselves up ALTER DATABASE app SET idle_in_transaction_session_timeout = '60s'; ALTER DATABASE app SET statement_timeout = '30s'; -- Postgres 14+: close sessions idle for a long time (careful with poolers) ALTER ROLE report_user SET idle_session_timeout = '10min'; New sessions pick these up. idle_in_transaction_session_timeout is the important one: it ends the session that forgot to commit, which also releases its locks. Step 6: Raise max_connections or add PgBouncer If the math says you really need more connections, you can raise the limit. It needs a restart, and each connection uses memory, so a small VPS can trade a connection error for the OOM killer (see the Linux OOM killer guide ): ALTER SYSTEM SET max_connections = 200; -- then: sudo systemctl restart postgresql For many app processes or serverless, a pooler is the better answer. PgBouncer in transaction mode lets hundreds of clients share a few dozen real connections. Some features (session-level prepared statements, SET , advisory locks) behave differently through it, so check your ORM's PgBouncer notes for your version before switching. While you're in the database config: if Postgres runs in Docker with ports: "5432:5432" , it's probably reachable from the internet despite UFW. Read why Docker bypasses UFW . Frequently asked questions What does "sorry, too many clients already" mean in Postgres? Every connection slot allowed by max_connections is in use, so Postgres refuses new connections. It usually means app connection pools are too large or connections are leaking, not that you have too many users. What does "remaining connection slots are reserved" mean? All normal slots are used and only the few reserved for superusers are left. You can still log in as the postgres superuser to investigate. Postgres 16 changed the wording to "reserved for roles with the SUPERUSER attribute". What is Prisma's default connection pool size? In Prisma 7 with driver adapters such as @prisma/adapter-pg, the pool comes from the driver and defaults to 10 connections. In Prisma 6, the default was the number of physical CPU cores times two plus one, set with connection_limit in the URL. Should I just increase max_connections? Only after you've sized the pools and fixed leaks. Each connection is a separate process that uses memory, so raising the limit a lot on a small server can cause memory problems. A pooler such as PgBouncer scales further. How do I find idle in transaction connections? Query pg_stat_activity for rows where state is 'idle in transaction' and look at now() minus state_change. Set idle_in_transaction_session_timeout so Postgres ends them automatically. Database refusing connections right now? I fix Postgres connection, performance and pooling problems in Node.js and NestJS apps, and size them so the next traffic spike doesn't take the API down. See my web development services or contact me now with the error and the output of the pg_stat_activity query above.

Read article →
Linux OOM Killer Killed Your App? Find and Fix It
Linux System AdminOct 6, 2026

Linux OOM Killer Killed Your App? Find and Fix It

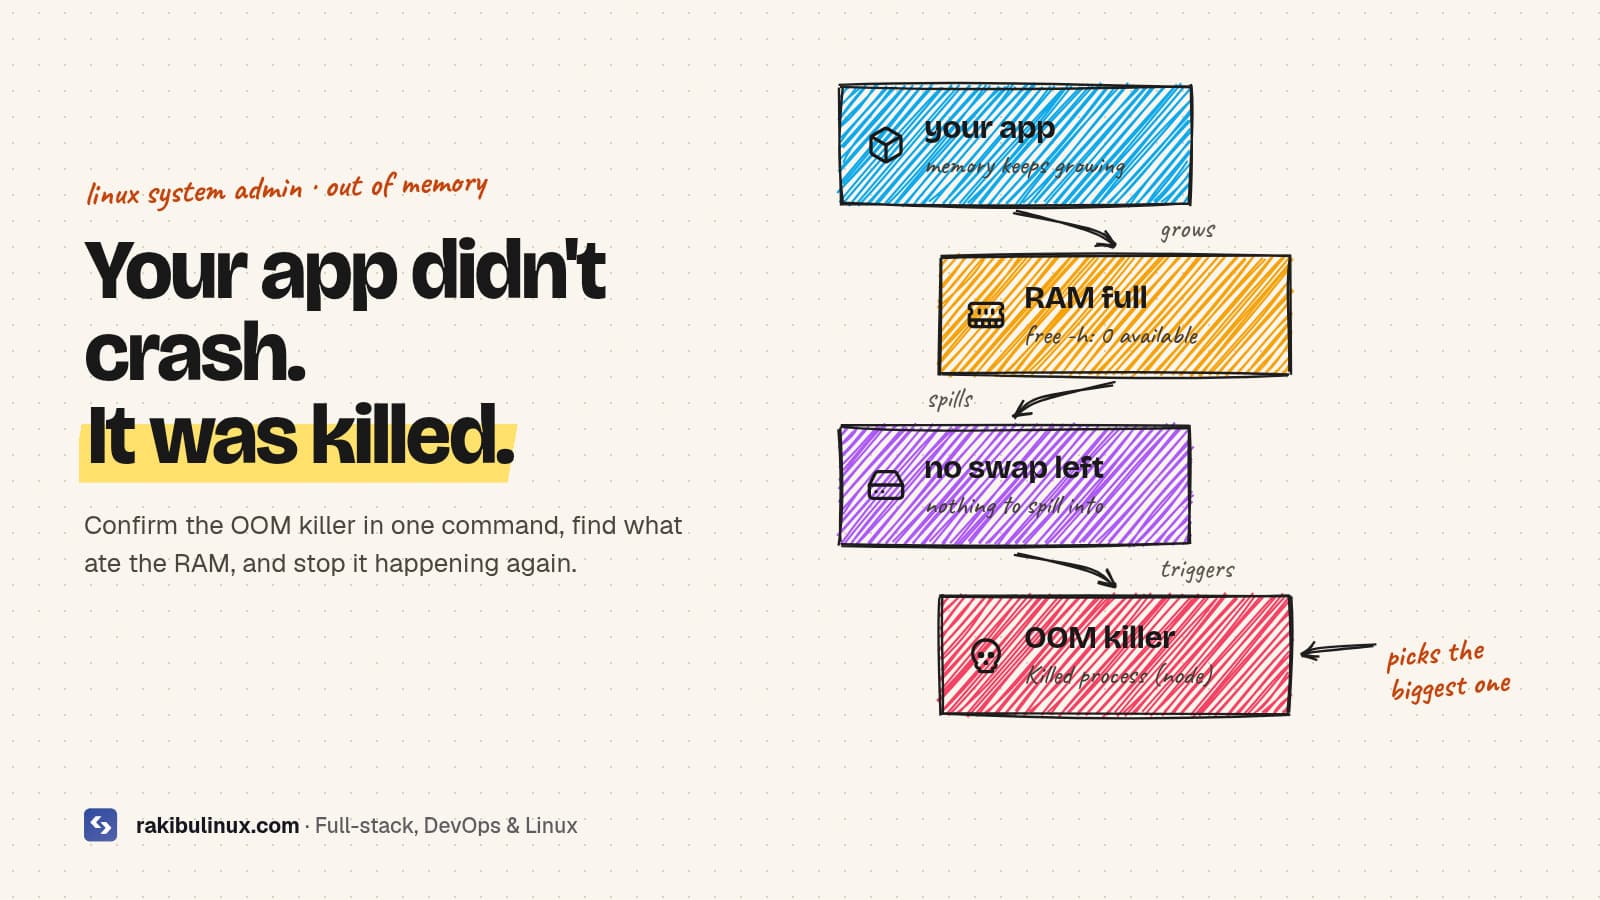
If your app dies with no error, the Linux OOM killer probably ended it. Run journalctl -k | grep -i "killed process" to confirm, then add swap and cap memory. The symptom is confusing: the app stops, there's no stack trace, the app log just ends, and Nginx starts returning 502s. Often it happens at the busiest time of day, or during a deploy. The reason is that the kernel ran out of memory and picked a process to kill so the whole server wouldn't freeze. Your app, usually the biggest process on a small VPS, was the pick. My own sites run a Next.js frontend and a NestJS API on one Ubuntu server, and this is the checklist I use to confirm it and keep it from happening. Key takeaways Confirm it in the kernel log: journalctl -k | grep -i -E 'killed process|out of memory' . The app's own log won't show it. The OOM killer picks the process with the highest score, which is mostly the one using the most memory. That's why it's usually your app or database. Add swap on small VPSs. It turns a sudden kill into a slowdown you can see and fix. Cap memory where it grows: Node's --max-old-space-size , PM2's max_memory_restart , Docker or systemd memory limits. Don't build on a tiny production server. next build or npm install on a 1-2 GB box is a classic trigger. Build in CI. Step 1: Confirm the OOM killer did it sudo journalctl -k --since "24 hours ago" | grep -i -E 'killed process|out of memory|oom-kill' # or, if the journal isn't persistent: sudo dmesg -T | grep -i -E 'killed process|out of memory' A hit looks like this (example): Out of memory: Killed process 4321 (node) total-vm:2412344kB, anon-rss:1489012kB, ... The name in brackets is what died, and anon-rss is roughly how much RAM it was using. If you see Memory cgroup out of memory instead, a container or systemd memory limit was hit rather than the whole server. In Docker that shows up as exit code 137 with OOMKilled: true ; my post on containers that keep restarting covers that side. Step 2: See where the memory goes free -h ps aux --sort=-%mem | head -n 10 systemd-cgtop -m # memory per service pm2 monit # if you use PM2 Look at the available column in free -h , not free . Linux uses spare RAM as disk cache, so "free" is always low on a healthy server. If available sits near zero and swap is 0B or full, you have your answer. Then ask what grew. A process that climbs steadily for hours is a leak. One that spikes is a heavy request: image processing, a big export, a query that loads a whole table into memory, or a build. When an app keeps growing and there's no free RAM or swap left, the kernel kills the process with the highest OOM score, which is usually the largest one. The app disappears without writing an error, and the site goes down. Step 3: Get the site back Restart the app ( pm2 restart app , systemctl restart app or docker compose up -d ) and check Nginx stops returning 502s. If it was killed without a process manager to bring it back, set one up now: PM2 with pm2 startup and pm2 save , or Restart=always in a systemd unit. Then fix the cause, or it will happen again at the next peak. Step 4: Add swap (if you have none) Many VPS images ship with no swap. A modest swap file gives the kernel somewhere to put idle pages and buys time before anything is killed: sudo fallocate -l 2G /swapfile sudo chmod 600 /swapfile sudo mkswap /swapfile sudo swapon /swapfile echo '/swapfile none swap sw 0 0' | sudo tee -a /etc/fstab # prefer RAM, use swap as a safety net echo 'vm.swappiness=10' | sudo tee /etc/sysctl.d/99-swappiness.conf sudo sysctl --system Check disk space first ( df -h / ); a swap file on a nearly full disk causes a different outage, see "No space left on device" . Swap is a safety net, not more RAM. If the server lives in swap all day, it needs a bigger plan or a smaller app. Step 5: Cap memory where it grows Node.js and PM2 Node's heap limit stops one process from taking everything, and PM2 restarts it cleanly before the kernel has to step in: // ecosystem.config.js module.exports = { apps: [{ name: "web", script: "node_modules/next/dist/bin/next", args: "start -p 3000", node_args: "--max-old-space-size=768", max_memory_restart: "900M", }], }; A restart at 900 MB is a quick, logged blip; an OOM kill is an outage with no explanation. Keep the restart threshold above the heap limit so the heap limit catches normal growth first. If it restarts every hour, you've confirmed a leak and the restart buys you time to find it. Docker and systemd # docker-compose.yml services: api: mem_limit: 768m # systemd: sudo systemctl edit app [Service] MemoryHigh=700M MemoryMax=800M A limit means only that container or service is killed, not whatever the kernel picks across the whole server. Databases Postgres and MySQL are sized at startup. On a small shared server, check shared_buffers and work_mem (Postgres) or innodb_buffer_pool_size (MySQL). A buffer pool tuned for a dedicated 8 GB server will starve everything else on a 2 GB VPS. Each extra database connection also costs memory, another reason not to run hundreds of them (see Postgres "too many clients" ). Step 6: Stop building on the production server Installing dependencies and building a Next.js app can briefly use more memory than the running site. On a 1-2 GB server that alone triggers the OOM killer, and it can take the live site with it. Build in CI and ship the finished release, as in my GitHub Actions deploy with auto-rollback and the Next.js on a VPS guide . Protect the processes that must survive You can tell the kernel to avoid certain services. In a systemd unit, OOMScoreAdjust=-500 makes it a much less likely target. Use it sparingly, for things like the database. Setting everything to "never kill" just means the kernel has nothing left to pick and the whole server hangs. Frequently asked questions How do I know if the OOM killer killed my process? Search the kernel log with journalctl -k or dmesg -T for "Killed process" or "Out of memory". The line names the process, its PID and how much memory it used when it was killed. Why does the OOM killer pick my app and not something else? It kills the process with the highest OOM score, which mostly follows how much memory a process uses. On a small server the main app or the database is usually the largest process, so it's the first target. How much swap should a VPS have? For a small web server, 1-2 GB of swap is a sensible safety net, with swappiness set low so RAM is preferred. Swap should absorb short spikes; if it's in constant use, the server needs more RAM or the app needs less. Is it safe to disable the OOM killer? No. Without it, a server that runs out of memory can freeze completely and need a hard reboot. Set memory limits and protect key services instead. Why does my server run out of memory during deploys? Installing packages and building the app use a lot of memory on top of the running site. Build in CI or on a separate machine and copy the finished build to the server. Server running out of memory? I find what's eating the RAM on Linux servers, fix the leak or the config, and set up limits, swap and alerts so the next spike doesn't take the site down. See my Linux system admin services or contact me now with the "Killed process" line from your kernel log.

Read article →