Skip to content
All articles
7 min read

Next.js 16 Images Broken or Blurry After Upgrade? Fix

MD Rakibul Islam RakibMD Rakibul Islam RakibFull-stack developer, DevOps & Linux engineer
Next.js 16 Images Broken or Blurry After Upgrade? Fix

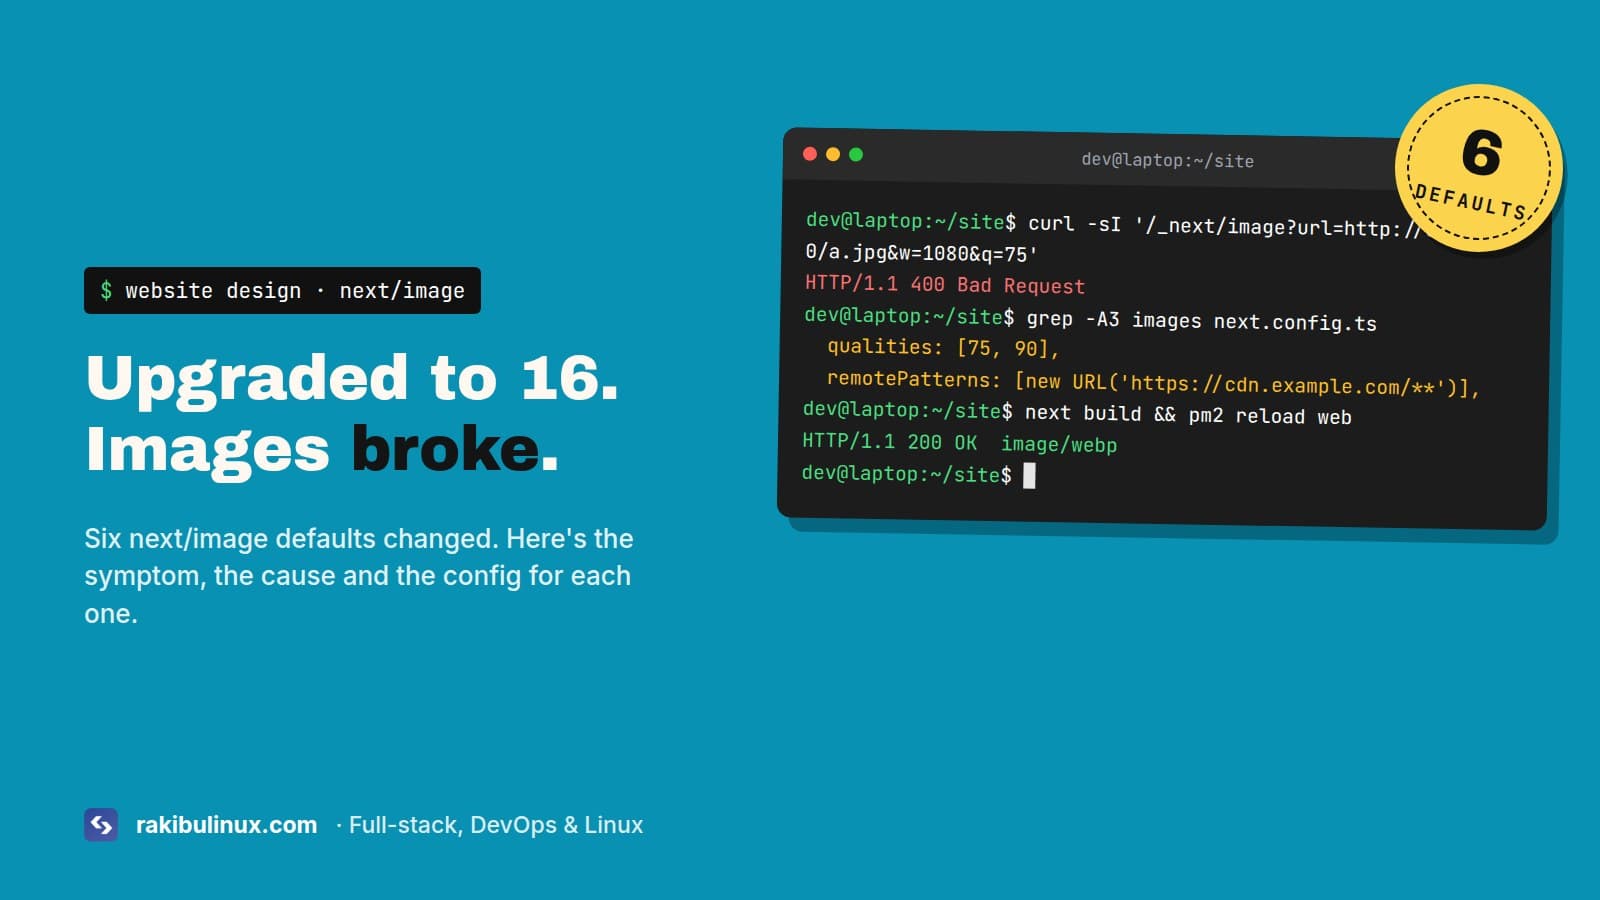
Next.js 16 changed next/image defaults: quality is fixed at 75, private IPs are blocked, query strings need localPatterns. Here's each fix.

Next.js 16 changed six image defaults at once. None of them breaks the build, which is what makes them annoying: the site deploys, and then a client emails to say the hero photo looks soft, the logo is gone, or the product images from their own API are all broken. This site runs Next.js 16 too, so these are the settings I check after every upgrade. Here's each symptom with its cause and the config that fixes it.

Key takeaways

  • Blurry images: quality={90} is silently turned into 75. Add the values you use to images.qualities.
  • Images from localhost, a Docker service name or a private IP return 400: set images.dangerouslyAllowLocalIP, or better, use a public URL.
  • /logo.png?v=2 fails: local images with query strings need images.localPatterns.
  • New image doesn't show up: optimized images are cached for 4 hours now. Change the file name, not just the file.
  • Move from images.domains to remotePatterns, and from priority to preload.

Images look blurry or low quality

Before 16, any quality from 1 to 100 was allowed. Now the default list is just [75], and the quality prop is rounded to the closest allowed value. So quality={95} on your hero image quietly becomes 75. No warning. Fix it by listing every quality you actually use:

// next.config.ts
const nextConfig = {
  images: {
    qualities: [75, 90],
  },
};

Keep the list short. Every extra value is another variant the server has to generate and cache, and the limit exists so nobody can ask your server for 100 versions of every image. 75 for most images and 90 for the hero and product photos is enough on almost every site I build.

Default: qualities [75] quality={90} [75] served at 75 · soft 9075 Fixed: qualities [75, 90] quality={90} [75, 90] served at 90 · sharp 90
Next.js 16 allows only quality 75 by default and rounds every other quality prop to it. Listing 90 in images.qualities lets the hero image keep its quality.

Images from your own API or storage return 400

This is the one that takes self-hosted sites down. Next.js 16 refuses to optimize images whose host resolves to a private IP address: localhost, 127.0.0.1, 10.x, 172.16-31.x, 192.168.x. It's protection against SSRF, where an attacker uses your image optimizer to fetch things from your internal network.

It hits you if your src points at an internal address, which is common with Docker Compose (http://api:5000/uploads/a.jpg), MinIO or RustFS on the same server, or an API that returns http://localhost:5000/... URLs. The browser gets a 400 from /_next/image, and the image is broken. In dev on your laptop it might still work, because your API is on a public URL there.

The right fix is to give images a public URL (https://cdn.example.com/...) and add it to remotePatterns. If the images genuinely live on a private network you control, you can turn the check off:

images: {
  dangerouslyAllowLocalIP: true,   // only if you understand the SSRF risk
},

A third option for some cases: if the files are already optimized (they went through an upload pipeline that resizes them), set unoptimized on those images, and the browser loads them directly.

Local images with a query string fail

Cache-busting like <Image src="/logo.png?v=3" /> now needs a localPatterns entry, or Next.js rejects it:

images: {
  localPatterns: [
    { pathname: "/assets/**", search: "" },        // no query string allowed
    { pathname: "/logo.png", search: "?v=3" },      // exact query only
  ],
},

Once you define localPatterns, any local path not listed returns 400. Add every folder you load images from, or you'll fix the logo and break everything else. Easier: drop the query string and rename the file when it changes (logo-v3.png), or import the image statically (import logo from "./logo.png"), which gets a content hash automatically.

"hostname is not configured under images"

Error: Invalid src prop (https://cdn.example.com/a.jpg) on `next/image`,
hostname "cdn.example.com" is not configured under images in your `next.config.js`

Not new in 16, but you'll see it when you remove the deprecated images.domains. remotePatterns replaces it, and you can now write it with URL objects:

images: {
  remotePatterns: [
    new URL("https://cdn.example.com/**"),
    { protocol: "https", hostname: "**.amazonaws.com", pathname: "/my-bucket/**" },
  ],
},

Keep the pattern as tight as you can. hostname: "**" makes your server an open image proxy for the whole internet, on your bandwidth bill.

You replaced an image and the old one still shows

images.minimumCacheTTL went from 60 seconds to 4 hours (14400). If you upload a new file under the same name and the source doesn't send its own Cache-Control, the old optimized version is served for up to 4 hours. Use a new file name for new content, which is good practice anyway because browsers and CDNs cache too. If an image really has to update in place, lower the TTL:

images: { minimumCacheTTL: 60 },

For a quick manual flush on a self-hosted app, delete .next/cache/images and restart.

Images behind a redirect break

The optimizer now follows at most 3 redirects (it used to be unlimited). Some image hosts and tracking links redirect more than that. Use the final URL as src, or raise images.maximumRedirects if you can't. You can check how many hops an image URL takes with curl -sIL URL | grep -i "^location".

The priority warning

The priority prop is deprecated. Use preload for the image that's your Largest Contentful Paint, usually the hero. Most of the time fetchPriority="high" on that image is all you need. Don't preload more than one or two images, or none of them gets priority. My guide to fixing slow LCP goes deeper into which image to pick.

One small change you probably won't notice: 16 was removed from the default imageSizes. If you use tiny 16 px icons through next/image, add it back or use a plain <img> for icons, which is what I'd do anyway.

Debug any broken image in 30 seconds

Right-click the broken image, open it in a new tab, and read the URL. It looks like /_next/image?url=...&w=1080&q=75. The response tells you which rule failed: a 400 with a message about the URL, a host or local pattern, or a 500 when fetching the source failed. Then check the server's logs (pm2 logs), because the optimizer logs the real reason there.

After-upgrade checklist

  • List every quality value you use in images.qualities.
  • Open each page with images from your API or storage on the production server, not just locally.
  • Search for ? in local image paths, and add localPatterns or rename the files.
  • Replace images.domains with tight remotePatterns.
  • Swap priority for preload on the LCP image and run PageSpeed Insights on the homepage.

Frequently asked questions

Why are my images blurry in Next.js 16?

The default allowed quality is now only 75, and other quality values are rounded to it. Add the values you need to images.qualities in next.config, for example [75, 90].

Why do images from localhost fail in Next.js 16?

Next.js 16 blocks image optimization for hosts that resolve to private IP addresses. Serve images from a public URL, or set images.dangerouslyAllowLocalIP: true if the source is on a private network you trust.

Is images.domains removed in Next.js 16?

It's deprecated, not removed. Switch to images.remotePatterns, which also accepts new URL("https://host/**") entries.

How long does Next.js cache optimized images?

At least 4 hours by default since Next.js 16 (minimumCacheTTL: 14400), longer if the source image sends a longer Cache-Control.

Site looks worse after the upgrade?

I upgrade Next.js sites without losing image quality, speed or rankings. Book my Next.js bug fix service, get a technical SEO audit and fix if speed scores dropped, or contact me. Still on middleware.ts? Read how to move to proxy.ts next.

MD Rakibul Islam Rakib

Written by

MD Rakibul Islam Rakib

Full-stack developer, DevOps engineer and Linux system administrator with 5+ years of production experience. I deploy, harden and fix servers and web apps for clients worldwide, and everything in this article runs on real servers I manage, including this site.

  • next.js 16 image
  • next/image qualities
  • dangerouslyAllowLocalIP
  • next image localPatterns
  • next image blurry

Keep reading

EADDRINUSE: Address Already in Use? Find Who Owns the Port
Linux System AdminOct 8, 2026

EADDRINUSE: Address Already in Use? Find Who Owns the Port

EADDRINUSE means another process already listens on that port. Find it with ss -ltnp, then stop it through pm2, Docker or systemd so it stays stopped. Killing the process is the answer you'll find everywhere, and it works for about five minutes. On servers, the port is often taken by something that restarts itself: pm2 bringing back an app someone thought they'd stopped, a Docker container with restart: always , or a systemd service nobody remembers creating. So the useful question isn't "how do I kill it" but "what is it, and who keeps starting it". The error node:net:1940 const ex = new UVExceptionWithHostPort(err, 'listen', address, port); ^ Error: listen EADDRINUSE: address already in use :::3000 at Server.setupListenHandle [as _listen2] (node:net:1940:16) code: 'EADDRINUSE', errno: -98, syscall: 'listen', address: '::', port: 3000 Next.js says it more politely: ⚠ Port 3000 is in use, trying 3001 instead. That looks harmless in development, but in production it means your app is now on a port Nginx doesn't proxy to, and the site returns 502. Key takeaways sudo ss -ltnp 'sport = :3000' shows the process ID and name holding the port. Check pm2, Docker and systemd before you kill anything, or the process restarts. A dev server suspended with Ctrl+Z still holds its port. Ctrl+C stops it; Ctrl+Z only pauses it. On macOS, port 5000 and 7000 are taken by AirPlay Receiver. Handle SIGTERM in your app, so restarts release the port cleanly. Step 1: Find what's on the port sudo ss -ltnp 'sport = :3000' State Recv-Q Send-Q Local Address:Port Peer Address:Port Process LISTEN 0 511 *:3000 *:* users:(("next-server (v1",pid=48211,fd=21)) Use sudo , or you won't see processes owned by other users and the Process column stays empty. lsof -i :3000 works too if it's installed. Then find out what that PID really is and who started it: ps -o pid,ppid,user,etime,cmd -p 48211 ps -o pid,cmd -p $(ps -o ppid= -p 48211) # its parent The parent is the useful part. PM2 v6...: God Daemon means pm2 owns it. containerd-shim or docker-proxy means Docker. PID 1 ( systemd ) means a service or an orphaned process. A bash or zsh means someone's terminal. Killing the process on port 3000 doesn't help if a process manager owns it. pm2, Docker or systemd starts it again and the new app still can't bind. Stop it through its manager instead. Step 2: Stop it the right way It's pm2 pm2 list pm2 stop web # or pm2 delete web if it shouldn't exist The classic mistake: the app runs under pm2, and then someone SSHes in and runs npm start by hand to "test something". Or two pm2 apps with different names both use port 3000, one crashes in a loop, and pm2 restarts it forever. Look for a restart counter in pm2 list that keeps going up. That loop also explains a lot of mystery 502 errors. My 502 Bad Gateway guide covers what Nginx sees in that situation. It's Docker docker ps --format '{{.Names}}\t{{.Ports}}' | grep 3000 docker compose down # in that project's folder A container publishing 3000:3000 holds the port on the host, even if the app inside has crashed. With restart: unless-stopped it comes back after you kill it, and after every reboot. It's a systemd service systemctl status 48211 # shows which unit owns the PID sudo systemctl disable --now old-app.service Typing a PID into systemctl status is a trick I use all the time. It tells you the unit name directly. It's an old terminal session If you pressed Ctrl+Z instead of Ctrl+C, the dev server is suspended, not stopped, and still holds the port. In that terminal, jobs lists it and fg brings it back so you can Ctrl+C it. If the terminal is gone, stop it by PID: kill 48211 # SIGTERM, lets it clean up sleep 2; kill -9 48211 2>/dev/null # only if it ignored SIGTERM Or in one go: sudo fuser -k 3000/tcp . Use that when you're sure nothing will restart it. macOS: port 5000 is AirPlay On macOS Monterey and later, the AirPlay Receiver listens on ports 5000 and 7000. A Flask or Express app on 5000 fails with EADDRINUSE on a fresh Mac, and lsof shows ControlCenter . Either turn off AirPlay Receiver in System Settings, under General, AirDrop & Handoff, or use a different port. I just use another port. It happens on every restart (nodemon, tsx watch) Your watcher starts the new process before the old one has released the port. Usually the old one doesn't exit on SIGTERM because something keeps the event loop alive: an open database pool, a Redis client, a setInterval . Close the server on shutdown: const server = app.listen(PORT); for (const sig of ["SIGTERM", "SIGINT"]) { process.on(sig, () => { server.close(() => process.exit(0)); setTimeout(() => process.exit(1), 10_000).unref(); // don't hang forever }); } In NestJS, call app.enableShutdownHooks() in main.ts and close your connections in onModuleDestroy . pm2 also benefits: pm2 reload sends SIGINT and waits kill_timeout (1.6 seconds by default) before force-killing. It happens in tests Every Jest test file that imports your server.js calls listen(3000) , and test files run in parallel. Export the app without listening, and only call listen() in the entry file. Supertest takes the app directly and picks a free port on its own: // app.ts: export const app = express(); ... no listen here // server.ts: app.listen(process.env.PORT ?? 3000); // test: await request(app).get("/health").expect(200); Use PORT from the environment Hard-coded ports are why two apps on one server end up fighting. Read process.env.PORT , write each app's port in its env file or pm2 ecosystem file, and keep a short list in the server's README of which app owns which port. Bind internal apps to 127.0.0.1 instead of all interfaces, so only Nginx can reach them. :::3000, 0.0.0.0 and localhost The :::3000 in the error means Node tried to listen on every IPv6 address, which on Linux also covers IPv4. So an app bound to 127.0.0.1:3000 and another trying :::3000 still collide. That part is expected. The related surprise is the opposite case: no error, but Nginx can't reach the app. Since Node 17, localhost can resolve to the IPv6 address ::1 first. An app listening on 127.0.0.1 and an Nginx config that proxies to http://localhost:3000 may not meet. Use the same explicit address on both sides, for example app.listen(3000, "127.0.0.1") and proxy_pass http://127.0.0.1:3000 . Frequently asked questions How do I find which process is using port 3000 on Linux? Run sudo ss -ltnp 'sport = :3000' or sudo lsof -i :3000 . Both show the PID and process name. Use sudo to see processes of other users. How do I kill the process on port 3000? sudo fuser -k 3000/tcp or kill <pid> . But check first whether pm2, Docker or systemd started it, or it restarts within seconds. Stop it through whatever manages it. Why does EADDRINUSE come back after I kill the process? A process manager restarts it. Check pm2 list , docker ps and systemctl status <pid> , and stop or disable it there. Why is port 5000 in use on my Mac? macOS AirPlay Receiver listens on ports 5000 and 7000. Turn it off in System Settings or run your app on another port. Apps fighting over your server? I sort out servers where apps, pm2, Docker and old services step on each other, and set them up so restarts are clean. Book my emergency Linux server fix , see my Linux system admin services , or contact me with the output of ss -ltnp .

Read article →
ENOSPC: System Limit for File Watchers Reached (Fix)
Linux System AdminOct 8, 2026

ENOSPC: System Limit for File Watchers Reached (Fix)

This ENOSPC error isn't about disk space: Linux ran out of inotify watches. Raise fs.inotify.max_user_watches in sysctl.d and stop watching node_modules. The machine I write this on has 64 GB of RAM, and Next.js dev with Turbopack still runs into the inotify limit on it. I raised the limit to 524,288 a while ago, and with VS Code, a desktop app or two, a Next.js monorepo and a NestJS API all watching files at the same time, it still runs out. So the "just raise the number" answer you find everywhere is half the story. Here's the whole thing: what the error means, how to see who's using the watches, the permanent fix, and the cases where raising the limit isn't enough. The error Error: ENOSPC: System limit for number of file watchers reached, watch '/home/me/app/node_modules/.pnpm/...' at FSWatcher.<computed> (node:internal/fs/watchers:247:19) errno: -28, syscall: 'watch', code: 'ENOSPC' You'll see it from next dev , Vite, webpack, Nodemon, Jest in watch mode, Angular, React Native's Metro, or VS Code's warning "Visual Studio Code is unable to watch for file changes in this large workspace". ENOSPC normally means "no space left on device", which is why so many people go and delete files first. Your disk is fine. If df -h really shows a full disk, that's a different problem, and my "No space left on device" guide is the one you want. Key takeaways Check the current limit: cat /proc/sys/fs/inotify/max_user_watches . Raise it permanently with a file in /etc/sysctl.d/ , then sudo sysctl --system . No reboot needed. The limit is per user, across all your programs. One editor can eat most of it. "Too many open files" from a watcher is a different limit, max_user_instances . In Docker, the limit comes from the host kernel. Change it on the host. Step 1: See the limit and who is using it cat /proc/sys/fs/inotify/max_user_watches cat /proc/sys/fs/inotify/max_user_instances On newer kernels the default for watches scales with RAM, so it varies a lot between machines. Older systems and many VPS images still sit at 8,192, which a single Next.js project can use up. To see which processes hold the watches (run with sudo to include every user): for p in $(find /proc/*/fd -lname 'anon_inode:inotify' 2>/dev/null | cut -d/ -f3 | sort -u); do printf "%8d %s\n" "$(cat /proc/$p/fdinfo/* 2>/dev/null | grep -c '^inotify')" "$(cat /proc/$p/comm)" done | sort -rn | head When I ran this on my machine, one desktop app alone held about 26,000 watches. Usually the top of the list is an editor or a dev server watching node_modules . That tells you whether to raise the limit or fix the tool. Example: inotify watches are shared by every program you run. An editor, a dev server and a type checker fill a 65,536 limit, and the next watcher fails with ENOSPC. At 524,288 the same load uses about an eighth. Step 2: Raise the limit permanently echo "fs.inotify.max_user_watches=524288" | sudo tee /etc/sysctl.d/99-inotify.conf echo "fs.inotify.max_user_instances=512" | sudo tee -a /etc/sysctl.d/99-inotify.conf sudo sysctl --system Check it took effect with the cat commands from step 1, then restart your dev server. The new limit applies right away; the server just has to set up its watchers again. Name the file 99-something.conf . Files in /etc/sysctl.d/ and /usr/lib/sysctl.d/ are applied in name order, and the last one wins. My Ubuntu install ships /usr/lib/sysctl.d/30-localsearch.conf , which sets watches to 65,536. A file named 10-inotify.conf would be overridden by it on every boot. That's a common reason the fix "doesn't survive a reboot". Find every place that sets it: grep -r inotify /etc/sysctl.conf /etc/sysctl.d/ /usr/lib/sysctl.d/ /run/sysctl.d/ 2>/dev/null Does a high limit use a lot of memory? Each watch that is actually in use costs about 1 KB of kernel memory on 64-bit systems. The limit is only a ceiling. 524,288 means "up to about 512 MB if every watch is used", which only happens if something is watching half a million files. On a laptop that's fine. On a small VPS, ask why something is watching that many files at all. Step 3: Stop watching node_modules Raising the limit treats the symptom. The tools shouldn't be watching tens of thousands of dependency files in the first place. VS Code: in settings.json , add "files.watcherExclude": { "**/node_modules/**": true, "**/.next/**": true, "**/dist/**": true } . It's the biggest win for most people. Vite: server.watch.ignored in vite.config.ts for large generated folders. Nodemon: watch only src : nodemon --watch src . Jest: watchPathIgnorePatterns for build output. Close old dev servers. Three forgotten next dev processes in other terminals each hold their own watches. pgrep -af "next dev" finds them. Step 4: When you can't raise the limit, poll On shared servers, in some containers or on WSL with files on the Windows side, you may not be allowed to change sysctl values, or inotify doesn't work at all. Then make the watcher poll instead. It costs some CPU but never hits the limit: # webpack / Next.js with --webpack WATCHPACK_POLLING=true next dev --webpack # chokidar-based tools (many older dev servers) CHOKIDAR_USEPOLLING=true npm run dev That first line is literally how I run this site's dev server, because Turbopack's watcher still exhausts the limit on this machine alongside everything else that's running. Docker and CI Containers share the host's kernel, so sysctl inside a container either fails or changes nothing useful. Set the limit on the host, or on the VM that runs Docker Desktop. In CI, a test run in watch mode is a mistake anyway. Run Jest and Vitest once with --watch=false or vitest run . "Too many open files" is the other limit Error: EMFILE: too many open files, watch inotify_init: Too many open files This one is usually about inotify instances , not watches. Each program that watches files opens at least one instance, and the default per user is 128. Raise fs.inotify.max_user_instances to 512 as in step 2. If it's the regular open file limit instead, ulimit -n shows it, and that's a systemd or limits.conf change. Seeing it on a production server? A production server shouldn't be watching files at all. On a server the usual cause is pm2 start app.js --watch left over from setup, or an app started with npm run dev instead of the production command. pm2's watch mode follows every file under the app folder, including node_modules and upload folders, and restarts the app on every change. Check with pm2 describe app | grep watch , turn it off with pm2 restart app --watch false or remove watch from the ecosystem file, and run pm2 save . Raising the limit on a server only hides that mistake. Frequently asked questions Does ENOSPC mean my disk is full? Not in this case. When the message says "System limit for number of file watchers reached", Linux ran out of inotify watches. Your disk can be empty and still get this error. What should max_user_watches be set to? 524,288 is the common value for development machines and is safe with 8 GB of RAM or more. On servers, keep it lower and find out why something needs so many watches. Why does the error come back after a reboot? The value was set with sysctl -w , which doesn't persist, or another file in /usr/lib/sysctl.d/ with a later name overrides yours. Use a file named 99-inotify.conf in /etc/sysctl.d/ . How do I fix ENOSPC in Docker? Raise fs.inotify.max_user_watches on the host machine. Containers use the host kernel's limits. Polling ( WATCHPACK_POLLING=true or CHOKIDAR_USEPOLLING=true ) is the fallback if you can't change the host. Dev environment fighting you? I set up and fix Linux development and production environments for Node.js teams, from watcher limits to full servers. Book my bug fix service , see my Linux system admin services , or contact me with the error and the output of the watcher script above.

Read article →
WebSocket Connection Failed Behind Nginx (Socket.IO Fix)
DevOpsOct 8, 2026

WebSocket Connection Failed Behind Nginx (Socket.IO Fix)

"WebSocket connection failed" behind Nginx means the upgrade isn't forwarded. Add proxy_http_version 1.1 plus the Upgrade and Connection headers. The API behind this site runs Socket.IO for live chat and notifications, behind Nginx on a VPS. Locally, on localhost:5000 , sockets just work. In production the console fills with this: WebSocket connection to 'wss://api.example.com/socket.io/?EIO=4&transport=websocket' failed: Often the app still kind of works, because Socket.IO quietly falls back to HTTP long-polling. Messages arrive late, the Network tab is full of polling requests, and every few seconds something reconnects. Here's how to find the cause, in the order I check. Key takeaways Nginx speaks HTTP/1.0 to backends and drops the Upgrade header unless you tell it otherwise. The handshake must return status 101 . Anything else (400, 404, 502) points to a specific cause below. "Session ID unknown" means more than one app instance and no sticky sessions. Plain WebSockets without pings are closed by Nginx after 60 seconds of silence. On an HTTPS site, the socket URL must be wss:// , never ws:// . Step 1: Look at the handshake DevTools, Network tab, filter by WS , reload. Click the request and check the status: 101 Switching Protocols: the socket connected. If it still drops, jump to the timeout section. 200 or 400 on a request with transport=websocket : Nginx didn't pass the upgrade. Step 2. 400 with {"code":1,"message":"Session ID unknown"} : multiple instances. Step 3. 404: wrong path. Nginx or the client points somewhere other than /socket.io/ . 502: the app isn't listening where Nginx proxies to. Check pm2 logs and ss -tlnp . Test the handshake from the server itself, bypassing the browser: curl -i -N \ -H "Connection: Upgrade" -H "Upgrade: websocket" \ -H "Sec-WebSocket-Version: 13" -H "Sec-WebSocket-Key: dGhlIHNhbXBsZSBub25jZQ==" \ "https://api.example.com/socket.io/?EIO=4&transport=websocket" You want HTTP/1.1 101 Switching Protocols on the first line. Run the same against http://127.0.0.1:5000/... on the server. If the app returns 101 directly but not through Nginx, the problem is the Nginx config. Step 2: Fix the Nginx config A WebSocket starts as an HTTP request that asks to "upgrade". Nginx talks HTTP/1.0 to backends by default, and the Upgrade and Connection headers are hop-by-hop, so Nginx doesn't forward them. You have to set them explicitly. Put the map in the http context (top of the site file works, outside server ): map $http_upgrade $connection_upgrade { default upgrade; '' close; } server { server_name api.example.com; location /socket.io/ { proxy_pass http://127.0.0.1:5000; proxy_http_version 1.1; proxy_set_header Upgrade $http_upgrade; proxy_set_header Connection $connection_upgrade; proxy_set_header Host $host; proxy_set_header X-Forwarded-For $proxy_add_x_forwarded_for; proxy_set_header X-Forwarded-Proto $scheme; proxy_read_timeout 3600s; } location / { proxy_pass http://127.0.0.1:5000; proxy_http_version 1.1; proxy_set_header Host $host; } } sudo nginx -t && sudo systemctl reload nginx Watch the proxy_pass line. With proxy_pass http://127.0.0.1:5000; (no trailing slash), the full /socket.io/... path goes to the app. With proxy_pass http://127.0.0.1:5000/; Nginx strips /socket.io/ , and the server answers 404. One character, and it's very easy to miss in a config review. If you serve the socket under a custom path, like /ws/ , set the same path on both the Socket.IO server and the client, and use it in the location . Nginx talks HTTP/1.0 to the backend and drops the Upgrade header by default, so the handshake fails. With HTTP/1.1 and the Upgrade and Connection headers set, Node.js answers 101 and the socket opens. Step 3: "Session ID unknown" with several instances Socket.IO starts with a few HTTP polling requests, then upgrades. Every one of those requests must reach the same process. With pm2 in cluster mode, Docker replicas or several servers behind a load balancer, request two lands on a different process, which has never heard of the session, and you get: 400 Bad Request {"code":1,"message":"Session ID unknown"} You have three options, from simplest: Skip polling. On the client, io(url, { transports: ["websocket"] }) . One connection, so it can't be split. Every current browser supports WebSockets. You lose the fallback for networks that block them, which is rare today. Sticky sessions in Nginx. An upstream with ip_hash; sends each client to the same backend. Users behind one company NAT all land on one instance, which is usually fine. Redis adapter. With more than one instance, a message emitted on instance A must reach users connected to instance B. That needs @socket.io/redis-adapter regardless of the options above. Without it, chat works for some users and not others, depending on which process they hit. If you don't need more than one process, don't run more than one. Our API runs a single pm2 fork, and Socket.IO is happy with that. Step 4: It connects, then drops every minute proxy_read_timeout defaults to 60 seconds. If nothing passes through the socket for 60 seconds, Nginx closes it. Socket.IO sends a ping every 25 seconds, so it usually stays alive. A plain ws server with no heartbeat gets cut off exactly 60 seconds after the last message. Raise the timeout on the socket location (as above) and add a ping from the server. Cloudflare closes idle WebSockets after about 100 seconds, so a heartbeat under that is a good idea anyway. Other causes I've run into Mixed content. The page is HTTPS and the client connects to ws:// . The browser blocks it. Use wss:// , or pass the HTTPS URL to io() and let it pick. CORS on the socket server. Socket.IO v3 and newer need an explicit cors: { origin: "https://www.example.com", credentials: true } option. Without it, the polling requests fail with a CORS error before the upgrade even starts. Version mismatch. A v2 client can't talk to a v4 server. EIO=3 in the URL means an old client. Upgrade the client or set allowEIO3: true on the server for a while. Firewall or another proxy. A cloud load balancer in front of Nginx needs WebSocket support and a long idle timeout too. Test the socket from the browser console When the app's own error handling hides what happened, connect by hand from DevTools on your site. If the page already loads the Socket.IO client, this shows the real reason: const s = io("https://api.example.com", { transports: ["websocket"] }); s.on("connect", () => console.log("connected", s.id)); s.on("connect_error", (e) => console.log("failed:", e.message, e.description)); Forcing websocket skips the polling fallback, so a broken upgrade fails loudly instead of quietly working through polling. "websocket error" points at Nginx or the network. "xhr poll error" with polling allowed points at CORS or a wrong URL. An auth error message means the socket reached your server and your own middleware rejected it. Frequently asked questions Why does my WebSocket work locally but fail in production? Locally the browser talks to Node directly. In production Nginx sits in between and doesn't forward the upgrade request unless you set proxy_http_version 1.1 and the Upgrade and Connection headers. What does "Session ID unknown" mean in Socket.IO? The polling requests of one client reached different server processes. Use transports: ["websocket"] on the client, sticky sessions, or run a single instance. With several instances, also add the Redis adapter. Why does my WebSocket disconnect after 60 seconds? Nginx's proxy_read_timeout is 60 seconds by default, and it closes idle connections. Raise it for the WebSocket location and send a heartbeat from the server. Does Cloudflare support WebSockets? Yes, on all plans, and it's on by default. Idle connections are closed after about 100 seconds, so keep a heartbeat running. Real-time features acting up? I build and fix Socket.IO chat and notification systems with NestJS and Next.js, including the Nginx and scaling side. Book my bug fix service for Node.js apps , get a VPS setup with Nginx done right , or contact me with a screenshot of the WS request in DevTools. If Nginx is returning 502 instead, start with my 502 Bad Gateway guide .

Read article →