How to Fix Slow LCP (Largest Contentful Paint) in 2026
 MD Rakibul Islam RakibFull-stack developer, DevOps & Linux engineer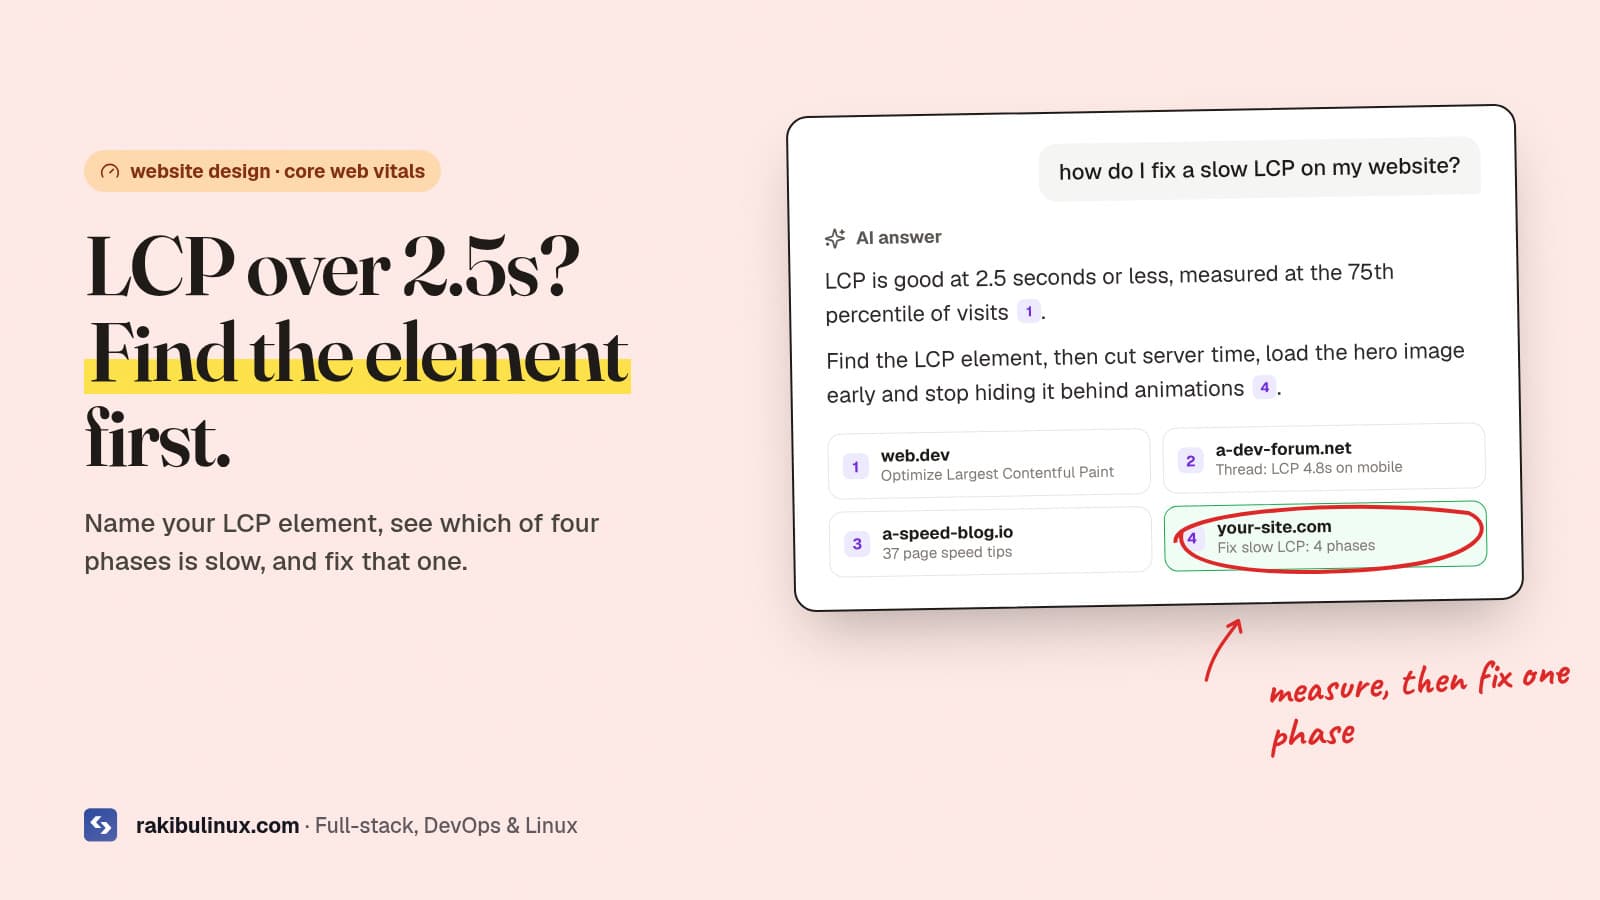
To fix a slow LCP, find your page's largest visible element, see which loading phase is slow, then speed up the server and load that image or text first.
Largest Contentful Paint is the Core Web Vital people fail most, and the advice online is a list of 30 tips with no order. That wastes days. LCP is one element on one page, and its time splits into four phases, so the fix is whichever phase is slow. When I redesigned this site I made the hero headline the LCP element on purpose and kept it out of any fade-in animation, because an animated hero can push LCP back even when everything loads fast. Here's the process I use on client sites, in order.
Key takeaways
- Good LCP is 2.5 seconds or less at the 75th percentile of real visits, on mobile and desktop separately. Over 4 seconds is poor.
- Find the LCP element first: usually the hero image, a background image, or the main headline.
- LCP has four phases: server response (TTFB), resource load delay, resource load duration and element render delay. Fix the biggest one.
- The most common bugs: a lazy-loaded hero image, a hero image discovered late (CSS background or JavaScript), an oversized image, and a slow, uncached server.
- Don't hide the hero behind an opacity-0 entrance animation or a client-side render.
Step 1: Measure real LCP, not just a lab score
Run your URL through PageSpeed Insights. The top section, "Discover what your real users are experiencing", is field data from the Chrome UX Report: that's what Google uses for Core Web Vitals. The Lighthouse score below it is a single simulated load on a throttled phone, useful for debugging but not the number you're judged on. Search Console's Core Web Vitals report groups your URLs by the same field data, so you can see which page templates fail.
If your site has too little traffic for field data, use the lab result and Chrome DevTools, but test on mobile throttling. Most sites that fail, fail on mobile.
Step 2: Find the LCP element
In PageSpeed Insights, open the Lighthouse diagnostic for the Largest Contentful Paint element. In Chrome DevTools, record a page load in the Performance panel and look at the LCP marker: it names the element and splits its time into phases. You can also paste this into the console and reload:
new PerformanceObserver((list) => {
  const e = list.getEntries().at(-1);
  console.log('LCP', Math.round(e.startTime), 'ms', e.element, e.url);
}).observe({ type: 'largest-contentful-paint', buffered: true });
Images (including CSS background images and video posters) and blocks of text can be the LCP element. If it's an image, note its URL and file size. If it's text, your problem is the server, fonts or JavaScript, not images.
Step 3: Fix the slow phase
Google's LCP optimisation guide suggests a rough healthy split: about 40% server response, 40% image download, and under 10% each for load delay and render delay. Compare your DevTools breakdown with that and go to the phase that's out of line.
Slow server response (TTFB)
If the HTML itself takes over a second to arrive, nothing else can start. Usual fixes:
- Cache full pages where you can: static generation or incremental regeneration in Next.js, a page cache plugin on WordPress, or a CDN that caches HTML.
- Remove redirect chains.
http://example.com→https://example.com→https://www.example.comcosts two extra round trips. Link and canonicalise to the final URL. - Find slow database queries and API calls in the page render. A page that waits on a slow backend is a smaller version of the problem in my 504 Gateway Timeout guide.
- Move the server closer to your visitors or put a CDN in front of it.
Long resource load delay
The browser found the hero image late or started it at low priority. This is the cheapest phase to fix:
- Never lazy-load the LCP image. Remove
loading="lazy"from anything above the fold. Many themes and plugins lazy-load every image by default. - Make it discoverable in the HTML. An image set as a CSS background or inserted by a JavaScript slider isn't found until the CSS or script runs. Use a real
<img>in the server-rendered HTML. - Raise its priority with
fetchpriority="high", or preload it if it must stay a background image:
<img src="/hero.avif" width="1200" height="600" alt="..." fetchpriority="high">

<link rel="preload" as="image" href="/hero.avif" fetchpriority="high">
In Next.js 16 the old priority prop on next/image is deprecated in favour of preload, and the Next.js docs say most pages should use loading="eager" or fetchPriority="high" on the hero image instead. Use it on one image per page, not all of them.
Long resource load duration
The image is simply too heavy. Serve AVIF or WebP, size it for the slot it fills (a 4000-pixel photo in a 1200-pixel hero wastes most of its bytes), use srcset and sizes so phones get a smaller file, and serve it from a CDN with long cache headers. next/image and most image CDNs do the resizing and format switch for you.
Long element render delay
The image or text is ready but not painted. Causes I see most:
- Entrance animations that start the hero at
opacity: 0and fade it in. Show the hero immediately and animate things below it. - Client-side rendering: the hero only appears after a JavaScript bundle loads and runs. Render it on the server.
- Render-blocking CSS and scripts in the
<head>. Defer non-critical scripts, and drop the third-party chat widgets and trackers you don't need on landing pages. - Web fonts blocking a text LCP. Use
font-display: swap(ornext/font, which handles it) and self-host the font files.
Step 4: Confirm the fix with real data
Lab tools show improvements right away. Field data in PageSpeed Insights and Search Console is a rolling 28-day window, so it takes a few weeks to move. After deploying, use Search Console's "Validate fix" on the Core Web Vitals issue and check back. Keep an eye on the other vitals too: making images load earlier without width and height can introduce layout shift (CLS).
Speed is part of SEO, but it isn't everything. If your pages aren't showing up on Google at all, start with my guide to "Crawled, currently not indexed", and see how to get cited by AI answers.
Frequently asked questions
What is a good LCP score?
2.5 seconds or less at the 75th percentile of page loads is good, between 2.5 and 4 seconds needs improvement, and over 4 seconds is poor. Google measures mobile and desktop separately.
Why is my LCP fine on desktop but poor on mobile?
Phones have slower CPUs and networks, so heavy images, big JavaScript bundles and slow servers hurt more. Mobile layouts can also pick a different LCP element, such as a large text block instead of the image. Test with mobile throttling.
Does LCP affect Google rankings?
Core Web Vitals, including LCP, are part of Google's page experience signals. They help, but relevance and content quality matter far more. Fix LCP because slow pages lose visitors and sales, and treat the ranking benefit as a bonus.
Should I lazy-load images to improve LCP?
Lazy-load images below the fold, but never the LCP image. Lazy-loading the hero tells the browser to wait, which is one of the most common causes of a poor LCP.
Why does my Lighthouse score change every time I run it?
Lighthouse runs one simulated load, so server response time, network conditions and third-party scripts vary between runs. Look at field data for the real picture, and run Lighthouse a few times when debugging.
Want a faster site?
I design and build fast websites, and I fix slow ones: server response, images, fonts and the hero section that decides your LCP. See my website design services, or contact me with your URL and I'll tell you what's slowing it down.

Written by
MD Rakibul Islam Rakib
Full-stack developer, DevOps engineer and Linux system administrator with 5+ years of production experience. I deploy, harden and fix servers and web apps for clients worldwide, and everything in this article runs on real servers I manage, including this site.
- Largest Contentful Paint
- fix LCP
- Core Web Vitals
- PageSpeed Insights
- fetchpriority high
- Next.js Image preload
- website speed