How to Fix Poor INP (Interaction to Next Paint)
 MD Rakibul Islam RakibFull-stack developer, DevOps & Linux engineer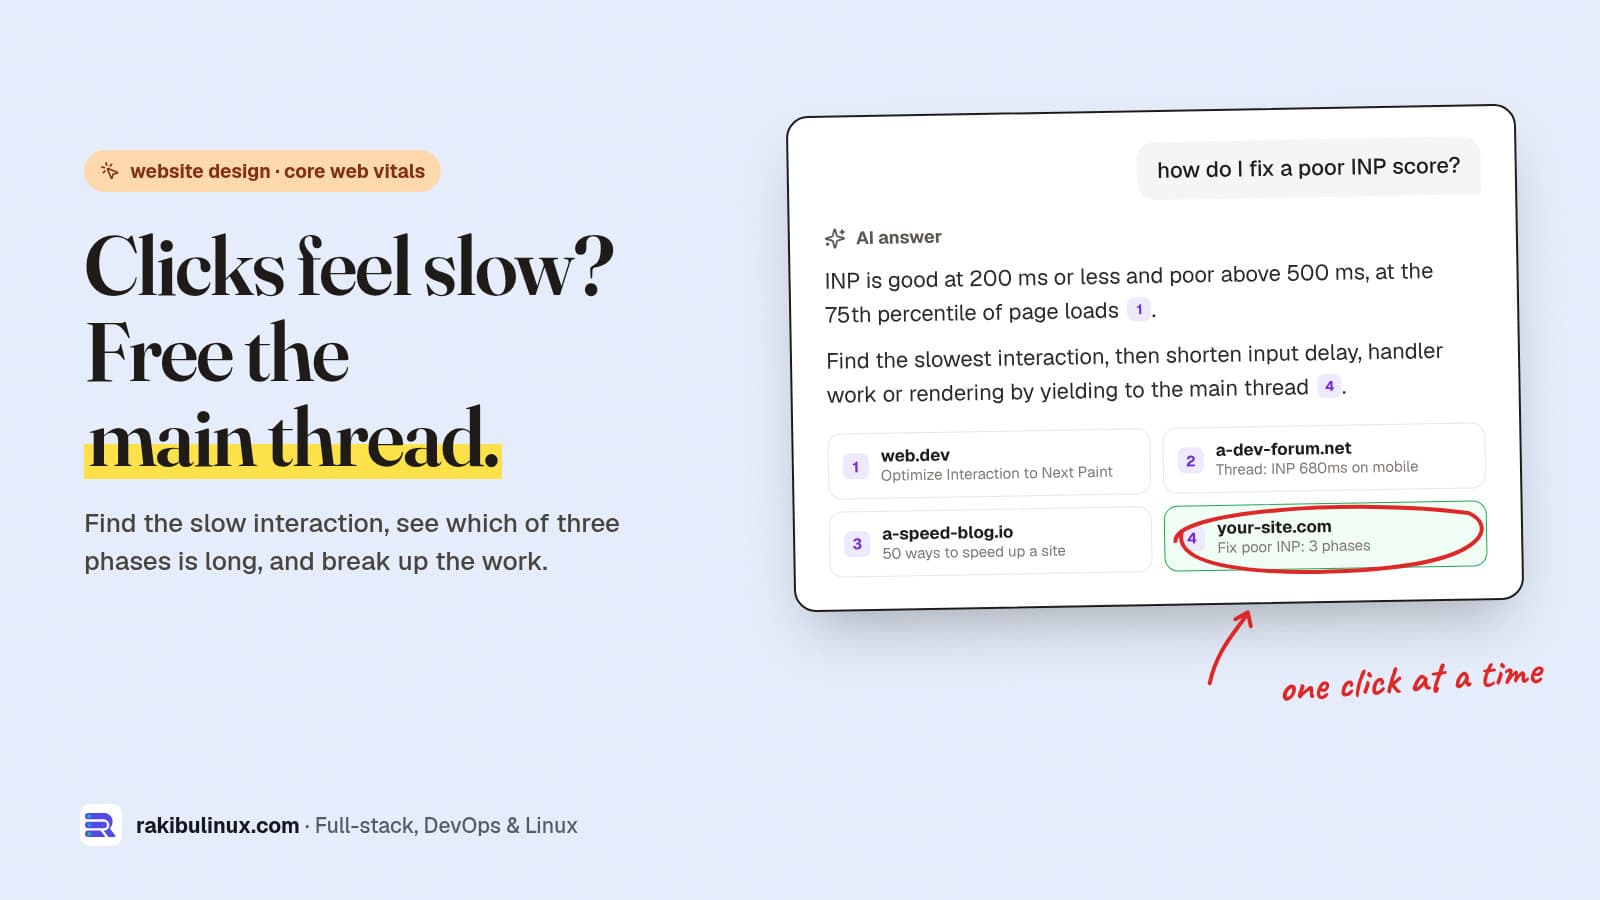
To fix poor INP, find your slowest interaction, see if input delay, handler time or rendering is long, and split that work into short tasks. Aim for 200 ms.
INP (Interaction to Next Paint) has been a Core Web Vital since March 2024, when it replaced First Input Delay. It's the one most sites fail now, because it measures every click, tap and key press during the whole visit, not only the first. A poor INP is what users describe as "the site feels laggy": a menu that opens late, a filter that freezes, an "Add to cart" button that doesn't react. I tune these on client sites built with React and Next.js, and the method below is the one that works: measure, find the slow phase, fix that phase.
Key takeaways
- Thresholds: 200 ms or less is good, over 500 ms is poor, measured at the 75th percentile of real visits (web.dev).
- Three phases: input delay (main thread busy), processing (your event handlers), presentation delay (rendering the next frame). Fix the one that's long.
- Long tasks are the enemy: any JavaScript task over 50 ms blocks clicks. Break work up and yield to the main thread.
- Third-party scripts (chat widgets, tag managers, heatmaps) are behind many bad INP scores. Load them late or remove them.
- In React, mark expensive updates with
useTransitionso the click paints first.
Step 1: Confirm you actually have an INP problem
INP is a field metric, so start with real-user data:
- Google Search Console, Core Web Vitals report: groups of URLs with "INP issue: longer than 200ms (mobile)".
- PageSpeed Insights: the top "Discover what your real users are experiencing" section shows INP from the Chrome UX Report. The Lighthouse lab score below it can't measure INP, because nobody clicks during a lab test. Total Blocking Time is the closest lab hint.
Mobile is almost always worse. A mid-range Android phone runs JavaScript several times slower than your laptop, so test on one, or use CPU throttling in DevTools.
Step 2: Find the slow interaction
Field data tells you that a page is slow, not which click. Two ways to find it:
- Chrome DevTools, Performance panel: open the page, turn on 4x CPU throttling, and click around. The live metrics view shows INP and lists each interaction with its duration. Record a trace of the slow one to see exactly which functions ran.
- The
web-vitalslibrary with attribution, to collect it from real users:
import { onINP } from 'web-vitals/attribution'

onINP(({ value, attribution }) => {
  // send to your analytics endpoint
  navigator.sendBeacon('/api/vitals', JSON.stringify({
    inp: Math.round(value),
    target: attribution.interactionTarget,   // CSS selector of the element
    inputDelay: attribution.inputDelay,
    processing: attribution.processingDuration,
    presentation: attribution.presentationDelay,
  }))
})
After a day of traffic you'll know the element and which of the three phases is long. That decides the fix.
Fix 1: Long input delay (the main thread was busy)
The user clicked while something else was running, often during page load. Typical causes and fixes:
- Third-party scripts. Audit them in DevTools (Performance trace, group by third party). Load chat widgets and heatmaps after the page is idle or on first interaction, and remove the ones nobody looks at. In Next.js,
<Script strategy="lazyOnload">does this. - Hydration of a huge page. In React and Next.js, keep components as server components unless they need interactivity, so less JavaScript runs on load. Fewer client components means a shorter hydration task.
- Timers and polling doing heavy work every few seconds. Make them lighter or pause them when the tab is hidden.
Fix 2: Long processing (your event handler is slow)
Do only what the user needs to see right away, then yield and do the rest later:
const yieldToMain = () =>
  globalThis.scheduler?.yield
    ? scheduler.yield()
    : new Promise((r) => setTimeout(r, 0))

button.addEventListener('click', async () => {
  showSpinner()            // visible feedback first
  await yieldToMain()      // let the browser paint it
  const result = filterProducts(allProducts)
  await yieldToMain()
  renderResults(result)
  sendAnalytics('filter')  // nobody waits for this
})
scheduler.yield() is supported in Chrome and Edge 129+ and Firefox 142+, but not Safari yet, hence the setTimeout fallback. In React, wrap the expensive state update in a transition so React renders the urgent part first and can interrupt the rest:
const [isPending, startTransition] = useTransition()

function onFilterChange(value) {
  setFilter(value)                       // urgent: the input updates now
  startTransition(() => setResults(filterProducts(value)))  // can wait
}
Also look for accidental work: a click that re-renders the whole page because state lives too high up, analytics calls that run synchronously, or JSON.parse of a large blob on every keystroke. Debounce search inputs.
Fix 3: Long presentation delay (rendering is slow)
The handler finished quickly but the browser takes long to lay out and paint. Usually the DOM is too big or layout is forced repeatedly:
- Shrink the DOM. Paginate or virtualise long lists and tables (render only what's on screen). Mega-menus with thousands of hidden nodes are a common culprit.
- Use
content-visibility: autoon long below-the-fold sections so the browser skips rendering them until they scroll into view. - Avoid layout thrashing: don't read
offsetHeightorgetBoundingClientRect()in a loop right after changing styles. Read everything first, then write. - Animate
transformandopacity, not width, height or top.
How long until Google sees the improvement?
Search Console and PageSpeed Insights use the Chrome UX Report, a rolling 28-day window of real visits. After you deploy a fix, the field numbers improve gradually over about four weeks. Your own web-vitals data shows the change the next day, which is another reason to collect it. If your LCP needs work too, my guide on fixing slow LCP follows the same measure-then-fix approach.
A quick INP checklist
- Check Search Console and PageSpeed field data on mobile.
- Find the slow element with DevTools live metrics or
web-vitals/attribution. - Input delay: defer third-party scripts and reduce client-side JavaScript on load.
- Processing: show feedback first, yield, then do the heavy work; use
useTransitionin React. - Presentation: smaller DOM,
content-visibility, no layout thrashing. - Re-check your own data the next day and CrUX after 28 days.
Speed is part of conversion, not only SEO. My landing page checklist covers the rest of what makes a page sell, and if you're weighing a rebuild, read AI website builder vs custom website first.
Frequently asked questions
What is a good INP score?
200 milliseconds or less at the 75th percentile of page visits is good. Between 200 and 500 milliseconds needs improvement, and above 500 milliseconds is poor.
Why does PageSpeed Insights not show INP in the lab score?
INP needs real interactions, and a Lighthouse lab run doesn't click anything. Use the field data section at the top of PageSpeed Insights, and Total Blocking Time in the lab section as a rough proxy.
Does INP affect Google rankings?
INP is one of the three Core Web Vitals Google uses as part of its page experience signals. It's a small ranking factor compared with content and relevance, but a slow, laggy page also loses visitors and sales, which matters more.
What is the most common cause of poor INP?
Long JavaScript tasks blocking the main thread, usually from third-party scripts, large client-side frameworks hydrating on load, or event handlers that do too much work before the page can paint a response.
Can WordPress sites have poor INP?
Yes, often because of page builders, many plugins and third-party widgets loading JavaScript on every page. Removing unused plugins and delaying non-essential scripts usually helps the most.
Want a site that feels instant?
I design and build fast websites and fix slow ones, from Core Web Vitals audits to rebuilding the parts that drag. See my website design services or contact me with your URL and I'll tell you what's slowing it down.

Written by
MD Rakibul Islam Rakib
Full-stack developer, DevOps engineer and Linux system administrator with 5+ years of production experience. I deploy, harden and fix servers and web apps for clients worldwide, and everything in this article runs on real servers I manage, including this site.
- Interaction to Next Paint
- fix INP
- Core Web Vitals
- long tasks
- scheduler.yield
- useTransition
- website speed