Skip to content
All articles
Updated 8 min read

OpenClaw on a VPS: Install and Secure It (2026 Guide)

MD Rakibul Islam RakibMD Rakibul Islam RakibFull-stack developer, DevOps & Linux engineer
OpenClaw on a VPS: Install and Secure It (2026 Guide)

OpenClaw is an open-source AI agent that acts for you from chat apps. Run it on its own VPS, keep the gateway on loopback, and reach it over SSH or Tailscale.

When I first wrote about OpenClaw in February 2026, it was the most talked-about open-source project of the year: an assistant you message on WhatsApp or Telegram that actually reads your email, runs commands and automates tasks. Since then it has also become a security lesson. Researchers found tens of thousands of gateways exposed to the internet, several serious CVEs, and over a thousand malicious skills on its ClawHub registry. I now set it up for clients the way I'd set up any service with shell access: isolated, private and audited. This guide explains what OpenClaw is and walks through that setup on Ubuntu.

Key takeaways

  • OpenClaw is an agent, not a chatbot. It runs on your machine or server and can execute commands, use a browser and act in your accounts.
  • Give it its own VPS and its own Linux user, not your laptop or a server with production data.
  • Keep the gateway on loopback (127.0.0.1:18789, the default) and reach it through an SSH tunnel or Tailscale Serve. Never open it to the internet.
  • Treat ClawHub skills like untrusted code. Malicious skills that steal credentials have been found there repeatedly.
  • Run openclaw security audit after setup and after every config change, and keep OpenClaw updated.

What is OpenClaw?

OpenClaw is a free, open-source personal AI assistant, first released in November 2025 by developer Peter Steinberger under the names Clawdbot and then Moltbot. It's now maintained by the OpenClaw Foundation. You install a gateway on a computer or server, connect a model (Claude, GPT, or a local model through Ollama), and talk to it through chat apps you already use: Telegram, WhatsApp, Slack, Discord, Signal and others.

The difference from ChatGPT is that OpenClaw takes actions. With the right permissions it can sort email, manage a calendar, browse websites, edit files, run shell commands and call APIs. It keeps memory between conversations and can be extended with "skills" from the community registry, ClawHub. That power is the reason to use it, and the reason it needs careful hosting.

Is OpenClaw safe?

OpenClaw ships with sensible defaults: the gateway binds to loopback, unknown people who message your bot get a pairing code instead of a response, and group chats are allowlisted. The incidents in 2026 mostly came from people changing those defaults or trusting third-party code:

  • Exposed gateways. Internet scans found very large numbers of OpenClaw gateways reachable from the public internet, many without authentication. Anyone who reaches an unauthenticated gateway can control the agent.
  • Vulnerabilities. CVE-2026-25253 (CVSS 8.8), disclosed in January 2026, let a crafted link leak the gateway token through the Control UI. More high-severity CVEs followed. Old versions stay vulnerable.
  • Malicious skills. Security firms including Bitdefender reported skills on ClawHub that installed info-stealing malware, disguised as productivity tools. By April 2026 more than 1,400 had been identified.

So: safe enough when isolated, updated and kept private; risky on your main laptop with every permission switched on.

Step 1: Give OpenClaw its own server and user

Use a fresh, small Ubuntu 24.04 VPS that holds nothing else: no production database, no client files, no SSH keys to other servers. If the agent is tricked by a prompt injection or a bad skill, the damage stays in that box. Harden it first with my Ubuntu 24.04 hardening checklist (key-only SSH, firewall, automatic updates), then create a normal user for OpenClaw:

sudo adduser --disabled-password --gecos "" claw
sudo install -d -m 700 -o claw -g claw /home/claw/.ssh
sudo cp ~/.ssh/authorized_keys /home/claw/.ssh/ && sudo chown claw:claw /home/claw/.ssh/authorized_keys
sudo ufw default deny incoming
sudo ufw allow OpenSSH
sudo ufw enable

Don't add claw to the sudo group. The agent shouldn't be able to become root.

Step 2: Install OpenClaw

Log in as claw. OpenClaw needs Node.js 24.16+ or 26.1+; the official installer adds a suitable Node version if it's missing. As with any curl | bash, you can download the script and read it first:

curl -fsSL https://openclaw.ai/install.sh -o install.sh
less install.sh
bash install.sh

The installer starts onboarding, which asks for your workspace, model provider and API key, gateway settings and chat channels. Keep the gateway bind on loopback when asked. To install the gateway as a service that survives reboots and logouts:

openclaw onboard --install-daemon
sudo loginctl enable-linger claw          # keep the user service running without a login
systemctl --user status openclaw-gateway
openclaw doctor

On Linux the gateway runs as a systemd user service. openclaw doctor checks the install and config, and openclaw doctor --fix repairs legacy settings after upgrades.

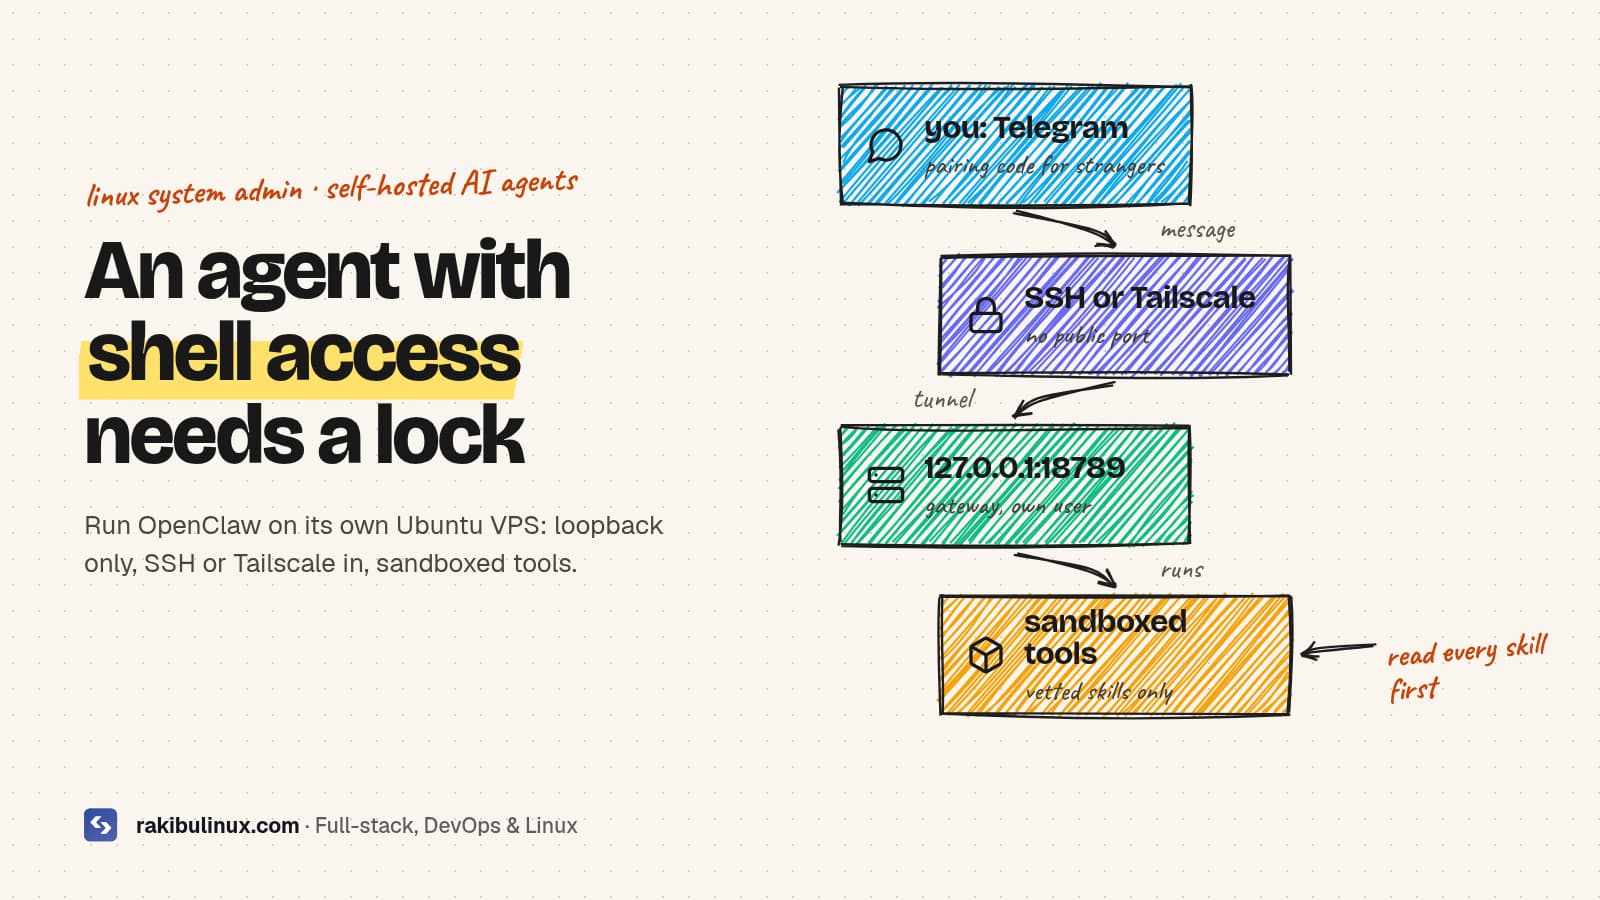
you SSH tunnel / Tailscale VPS (own user, no sudo) gateway127.0.0.1:18789 sandboxed toolsvetted skills scanner firewall: 18789 not public
You reach the gateway through an encrypted tunnel to localhost. Internet scanners hit the firewall and see nothing, because the gateway never listens on a public interface.

Step 3: Keep the gateway private

The gateway's WebSocket and Control UI listen on 127.0.0.1:18789 by default. Leave it that way. Check it:

ss -tlnp | grep 18789        # must show 127.0.0.1:18789, never 0.0.0.0 or [::]

To use the Control UI or the CLI from your laptop, forward the port over SSH:

ssh -N -L 18789:127.0.0.1:18789 claw@your-vps
# then open http://127.0.0.1:18789 on your laptop

If you want access from your phone or several devices, Tailscale Serve is the officially supported option: it publishes the loopback port only inside your private tailnet, with HTTPS. Don't put the gateway behind a public Nginx reverse proxy unless you follow OpenClaw's exposure runbook and use trusted-proxy authentication. And if you run OpenClaw in Docker, remember that published container ports bypass UFW; see Docker bypasses UFW.

Step 4: Sandbox tools and vet skills

OpenClaw can run tool calls inside Docker or Podman sandboxes instead of directly on the host. The documented minimal setup in ~/.openclaw/openclaw.json:

{
  agents: {
    defaults: {
      sandbox: {
        mode: "non-main",
        scope: "session",
        workspaceAccess: "none",
      },
    },
  },
}

Then be strict about skills:

  • Install as few as possible, from authors you can identify.
  • Read the skill before installing. Red flags: install steps that download and run binaries, obfuscated scripts, requests for credentials unrelated to the task.
  • Don't give the agent your main email, password manager or crypto wallets. Use separate accounts with limited scopes where you can.
  • Watch for prompt injection. Any web page or email the agent reads can contain instructions. Keep risky tools behind approval.

Step 5: Audit and update

openclaw security audit
openclaw status

openclaw security audit checks your config against OpenClaw's security baseline (exposure, auth, channel access, tool permissions) and lists findings in priority order. Run it after setup, after every config change and after updates. Then update regularly: most of 2026's serious CVEs were fixed quickly, and the exposed instances that got abused were usually old versions.

What is OpenClaw good for?

  • Personal admin: inbox triage, reminders, calendar, summaries sent to your phone.
  • Developer chores: checking CI, summarising logs, opening issues, running scripts in a sandbox.
  • Research: browsing, collecting and summarising sources on a schedule.
  • Private AI: paired with a local model, nothing leaves your server. My guide to self-hosting an LLM with Ollama covers that side.

If you're building your own tools for agents instead, see how to build an MCP server in TypeScript.

Frequently asked questions

What is OpenClaw used for?

OpenClaw is a self-hosted AI agent you control through chat apps like Telegram or WhatsApp. People use it to automate email, calendars, research, browsing and developer tasks, because it can take actions instead of only answering.

Is OpenClaw free?

OpenClaw itself is free and open source. You pay for the server it runs on and for the AI model it uses, unless you run a local model with Ollama.

Can I run OpenClaw on a VPS?

Yes, and it's the setup I recommend: a dedicated Ubuntu VPS, a non-root user, the gateway installed as a systemd user service, and access over an SSH tunnel or Tailscale, with no public port.

Is it safe to install skills from ClawHub?

Only after reviewing them. Security researchers have found more than a thousand malicious skills on ClawHub that stole credentials. Install few skills, read their code and install steps, and run tools in a sandbox.

What port does OpenClaw use?

The gateway listens on port 18789 on loopback (127.0.0.1) by default, configurable with gateway.port. Keep it off public interfaces.

Want OpenClaw set up securely?

I deploy OpenClaw and other self-hosted AI tools on isolated, hardened Linux servers with private access, sandboxing, backups and updates, so you get the automation without exposing your accounts. See my Linux system admin services or tell me what you want to automate.

MD Rakibul Islam Rakib

Written by

MD Rakibul Islam Rakib

Full-stack developer, DevOps engineer and Linux system administrator with 5+ years of production experience. I deploy, harden and fix servers and web apps for clients worldwide, and everything in this article runs on real servers I manage, including this site.

  • OpenClaw
  • OpenClaw VPS
  • OpenClaw security
  • self-hosted AI agent
  • ClawHub
  • Tailscale
  • Ubuntu

Keep reading

Kubernetes vs Docker Compose: Which Do You Need? (2026)
DevOpsOct 9, 2026

Kubernetes vs Docker Compose: Which Do You Need? (2026)

Use Docker Compose for a few apps on one or two servers. Move to Kubernetes when you need many nodes, autoscaling or zero-downtime rollouts across a cluster. "Should we be on Kubernetes?" is one of the first questions startups and agencies ask me, usually because a job post, an investor or a blog said so. Most of the time the honest answer is "not yet". This website and its API run in production on a single server with PM2 and Nginx, and I deploy self-hosted tools like Jitsi Meet with Docker Compose on single servers. Here is how I decide, without the hype in either direction. Key takeaways Different jobs: Compose runs a group of containers on one machine. Kubernetes schedules containers across a cluster of machines and keeps them in the desired state. Compose is enough for most apps with one to roughly ten services, one or two servers, and a team without a dedicated platform engineer. Kubernetes pays off with many services, multiple nodes, autoscaling, strict uptime targets and people who can run it. The real cost of Kubernetes is people, not servers: upgrades, networking, ingress, monitoring and on-call. Middle ground exists: k3s, managed Kubernetes, or a PaaS layer such as Coolify or Kamal on plain servers. What Docker Compose actually does Compose reads one compose.yaml file and starts the containers, networks and volumes it describes on a single Docker host. In production it gives you restart policies, health checks, start order and environment files: services: api: image: ghcr.io/acme/api:1.4.2 restart: unless-stopped env_file: .env depends_on: db: condition: service_healthy ports: - "127.0.0.1:5000:5000" db: image: postgres:17 restart: unless-stopped volumes: - pgdata:/var/lib/postgresql/data healthcheck: test: ["CMD-SHELL", "pg_isready -U postgres"] interval: 10s volumes: pgdata: Deploying is docker compose pull && docker compose up -d --wait . What Compose doesn't do: spread containers across several machines, move them when a server dies, or autoscale. If the host goes down, everything on it goes down until it comes back. My Docker Compose production checklist covers the settings that make a single host solid, including binding ports to 127.0.0.1 so Docker doesn't bypass your firewall . What Kubernetes adds Kubernetes treats a group of servers as one pool. You declare what should run (a Deployment with three replicas, a Service, an Ingress), and its control plane keeps reality matching that declaration: Self-healing across machines: if a node dies, its pods are rescheduled on healthy nodes. Rolling updates and rollbacks built in, gated by readiness probes. Horizontal autoscaling of pods on CPU, memory or custom metrics, and of nodes with a cluster autoscaler on cloud providers. Service discovery, config, secrets and network policies as first-class objects. A huge ecosystem: Helm charts, operators for databases, GitOps tools like Argo CD and Flux. The price is complexity. A production cluster needs an ingress controller, certificate management, a storage class for volumes, monitoring and log collection, and someone who understands how they fail. Kubernetes ships about three minor releases a year, and each is supported for a limited time, so upgrades are a regular chore, not a one-off. Compose keeps every container on one server, which is simple but means one machine is one point of failure. Kubernetes spreads pods across nodes and reschedules them when a node fails, at the cost of a lot more to run and understand. Choose Docker Compose when You have one app or a handful of services (web, API, worker, database, cache). One good server handles the load, maybe with a second for the database or as a warm standby. A few minutes of downtime during a rare server failure is acceptable, and you have tested backups. Nobody on the team wants to be a Kubernetes administrator. Budget matters: one VPS is far cheaper than three or more nodes plus load balancers. My self-hosting cost breakdown shows how far a single server goes. For zero-downtime deploys without Kubernetes, use release folders or blue/green containers behind Nginx with a health check and automatic rollback. That's how this site deploys (see GitHub Actions deploy with auto-rollback ). Choose Kubernetes when You run many services owned by several teams and need a common way to deploy them. Traffic is spiky enough that autoscaling saves real money or prevents outages. You need high availability across machines or zones, with uptime commitments to customers. You already depend on its ecosystem (operators, service mesh, GitOps), or a customer requires it. You have, or will pay for, people who can operate it: in-house, a managed service, or a contractor on retainer. The middle ground Managed Kubernetes (EKS, GKE, AKS, DigitalOcean, and others) runs the control plane for you. You still own the workloads, ingress, upgrades of node pools and add-ons. Check each provider's current pricing for control plane fees. k3s is a lightweight, certified Kubernetes distribution. Its docs list 2 CPU cores and 2 GB RAM as the minimum for a server node, so it fits on small VPSs and is a good way to learn or run a small cluster. A PaaS layer on your own servers such as Coolify, Dokku or Kamal gives you git-push deploys, SSL and multiple apps per server without running a cluster. Migrating from Compose to Kubernetes later Starting with Compose doesn't lock you in. Containers are the same images; what changes is the deployment description. Keep these habits and the move is mostly translation: Configure everything with environment variables, never baked-in files. Keep containers stateless; data lives in the database or object storage (I moved uploads to S3-compatible storage for this reason, see self-hosted S3 options ). Expose a health endpoint and log to stdout. Tag images by version, never deploy latest . Tools like Kompose can generate starter Kubernetes manifests from a compose.yaml , but review them; production manifests need resource limits, probes and ingress rules it can't guess. Frequently asked questions Is Docker Compose good enough for production? Yes, for many apps. With restart policies, health checks, pinned image versions, a reverse proxy, monitoring and tested backups, Compose on a single well-sized server runs plenty of real businesses reliably. Is Kubernetes overkill for a small startup? Usually, before you have several services, real traffic and someone to run it. The time spent on the cluster is time not spent on the product. Revisit the decision when scaling or uptime problems actually appear. Can Docker Compose run on multiple servers? Not by itself; Compose targets a single Docker host. You can run separate Compose stacks on several servers behind a load balancer, or use Docker Swarm, which accepts a similar file format, but at that point compare it with k3s or managed Kubernetes. What is the difference between Kubernetes and Docker? Docker builds and runs containers. Kubernetes orchestrates containers across many machines: it decides where they run, restarts them, scales them and routes traffic to them. Kubernetes runs standard container images, including the ones you build with Docker. Is k3s production ready? Yes. k3s is a CNCF-certified Kubernetes distribution used in production, especially on edge devices and small clusters. You still need the usual Kubernetes skills to operate it. Not sure which one fits? I set up Docker Compose and Kubernetes environments for startups and agencies, and I'll tell you honestly when you don't need the bigger one. See my DevOps services or contact me with a short description of your app and traffic.

Read article →
How to Fix Poor INP (Interaction to Next Paint)
Website DesignOct 9, 2026

How to Fix Poor INP (Interaction to Next Paint)

To fix poor INP, find your slowest interaction, see if input delay, handler time or rendering is long, and split that work into short tasks. Aim for 200 ms. INP (Interaction to Next Paint) has been a Core Web Vital since March 2024, when it replaced First Input Delay. It's the one most sites fail now, because it measures every click, tap and key press during the whole visit, not only the first. A poor INP is what users describe as "the site feels laggy": a menu that opens late, a filter that freezes, an "Add to cart" button that doesn't react. I tune these on client sites built with React and Next.js, and the method below is the one that works: measure, find the slow phase, fix that phase. Key takeaways Thresholds: 200 ms or less is good, over 500 ms is poor, measured at the 75th percentile of real visits ( web.dev ). Three phases: input delay (main thread busy), processing (your event handlers), presentation delay (rendering the next frame). Fix the one that's long. Long tasks are the enemy: any JavaScript task over 50 ms blocks clicks. Break work up and yield to the main thread. Third-party scripts (chat widgets, tag managers, heatmaps) are behind many bad INP scores. Load them late or remove them. In React, mark expensive updates with useTransition so the click paints first. Step 1: Confirm you actually have an INP problem INP is a field metric, so start with real-user data: Google Search Console, Core Web Vitals report: groups of URLs with "INP issue: longer than 200ms (mobile)". PageSpeed Insights: the top "Discover what your real users are experiencing" section shows INP from the Chrome UX Report. The Lighthouse lab score below it can't measure INP, because nobody clicks during a lab test. Total Blocking Time is the closest lab hint. Mobile is almost always worse. A mid-range Android phone runs JavaScript several times slower than your laptop, so test on one, or use CPU throttling in DevTools. Step 2: Find the slow interaction Field data tells you that a page is slow, not which click. Two ways to find it: Chrome DevTools, Performance panel: open the page, turn on 4x CPU throttling, and click around. The live metrics view shows INP and lists each interaction with its duration. Record a trace of the slow one to see exactly which functions ran. The web-vitals library with attribution , to collect it from real users: import { onINP } from 'web-vitals/attribution' onINP(({ value, attribution }) => { // send to your analytics endpoint navigator.sendBeacon('/api/vitals', JSON.stringify({ inp: Math.round(value), target: attribution.interactionTarget, // CSS selector of the element inputDelay: attribution.inputDelay, processing: attribution.processingDuration, presentation: attribution.presentationDelay, })) }) After a day of traffic you'll know the element and which of the three phases is long. That decides the fix. INP is the time from a click to the next painted frame: input delay, then your handlers, then rendering. Splitting the work into short tasks and deferring what the user doesn't need to see yet lets the browser paint the response first. Fix 1: Long input delay (the main thread was busy) The user clicked while something else was running, often during page load. Typical causes and fixes: Third-party scripts. Audit them in DevTools (Performance trace, group by third party). Load chat widgets and heatmaps after the page is idle or on first interaction, and remove the ones nobody looks at. In Next.js, <Script strategy="lazyOnload"> does this. Hydration of a huge page. In React and Next.js, keep components as server components unless they need interactivity, so less JavaScript runs on load. Fewer client components means a shorter hydration task. Timers and polling doing heavy work every few seconds. Make them lighter or pause them when the tab is hidden. Fix 2: Long processing (your event handler is slow) Do only what the user needs to see right away, then yield and do the rest later: const yieldToMain = () => globalThis.scheduler?.yield ? scheduler.yield() : new Promise((r) => setTimeout(r, 0)) button.addEventListener('click', async () => { showSpinner() // visible feedback first await yieldToMain() // let the browser paint it const result = filterProducts(allProducts) await yieldToMain() renderResults(result) sendAnalytics('filter') // nobody waits for this }) scheduler.yield() is supported in Chrome and Edge 129+ and Firefox 142+, but not Safari yet, hence the setTimeout fallback. In React, wrap the expensive state update in a transition so React renders the urgent part first and can interrupt the rest: const [isPending, startTransition] = useTransition() function onFilterChange(value) { setFilter(value) // urgent: the input updates now startTransition(() => setResults(filterProducts(value))) // can wait } Also look for accidental work: a click that re-renders the whole page because state lives too high up, analytics calls that run synchronously, or JSON.parse of a large blob on every keystroke. Debounce search inputs. Fix 3: Long presentation delay (rendering is slow) The handler finished quickly but the browser takes long to lay out and paint. Usually the DOM is too big or layout is forced repeatedly: Shrink the DOM. Paginate or virtualise long lists and tables (render only what's on screen). Mega-menus with thousands of hidden nodes are a common culprit. Use content-visibility: auto on long below-the-fold sections so the browser skips rendering them until they scroll into view. Avoid layout thrashing: don't read offsetHeight or getBoundingClientRect() in a loop right after changing styles. Read everything first, then write. Animate transform and opacity , not width, height or top. How long until Google sees the improvement? Search Console and PageSpeed Insights use the Chrome UX Report, a rolling 28-day window of real visits. After you deploy a fix, the field numbers improve gradually over about four weeks. Your own web-vitals data shows the change the next day, which is another reason to collect it. If your LCP needs work too, my guide on fixing slow LCP follows the same measure-then-fix approach. A quick INP checklist Check Search Console and PageSpeed field data on mobile. Find the slow element with DevTools live metrics or web-vitals/attribution . Input delay: defer third-party scripts and reduce client-side JavaScript on load. Processing: show feedback first, yield, then do the heavy work; use useTransition in React. Presentation: smaller DOM, content-visibility , no layout thrashing. Re-check your own data the next day and CrUX after 28 days. Speed is part of conversion, not only SEO. My landing page checklist covers the rest of what makes a page sell, and if you're weighing a rebuild, read AI website builder vs custom website first. Frequently asked questions What is a good INP score? 200 milliseconds or less at the 75th percentile of page visits is good. Between 200 and 500 milliseconds needs improvement, and above 500 milliseconds is poor. Why does PageSpeed Insights not show INP in the lab score? INP needs real interactions, and a Lighthouse lab run doesn't click anything. Use the field data section at the top of PageSpeed Insights, and Total Blocking Time in the lab section as a rough proxy. Does INP affect Google rankings? INP is one of the three Core Web Vitals Google uses as part of its page experience signals. It's a small ranking factor compared with content and relevance, but a slow, laggy page also loses visitors and sales, which matters more. What is the most common cause of poor INP? Long JavaScript tasks blocking the main thread, usually from third-party scripts, large client-side frameworks hydrating on load, or event handlers that do too much work before the page can paint a response. Can WordPress sites have poor INP? Yes, often because of page builders, many plugins and third-party widgets loading JavaScript on every page. Removing unused plugins and delaying non-essential scripts usually helps the most. Want a site that feels instant? I design and build fast websites and fix slow ones, from Core Web Vitals audits to rebuilding the parts that drag. See my website design services or contact me with your URL and I'll tell you what's slowing it down.

Read article →
How to Create a systemd Service for Your App (Linux)
Linux System AdminOct 9, 2026

How to Create a systemd Service for Your App (Linux)

To run an app as a systemd service, write a unit file in /etc/systemd/system, run daemon-reload, then systemctl enable --now. It restarts on crash and boot. If your app only runs while your SSH session is open, or dies after every reboot, it needs a service manager. systemd is already on every mainstream Linux server (Ubuntu, Debian, RHEL, Rocky, Alma), so there's nothing to install. On my own servers PM2 runs the Node apps, and PM2 itself is started by a systemd unit that pm2 startup generates. For everything else (workers, Python apps, Go binaries, bots) I write the unit by hand. Here's the template I use and how to debug it when it won't start. Key takeaways Unit files live in /etc/systemd/system/ and end in .service . Never edit the ones in /lib/systemd/system/ . Four lines matter most: User= , WorkingDirectory= , ExecStart= with an absolute path, and Restart=on-failure . After every edit: sudo systemctl daemon-reload , then restart the service. Logs are in journald: journalctl -u myapp -f . No log files to rotate. Exit codes tell you what's wrong: 203/EXEC is a bad path, 200/CHDIR a bad working directory, 217/USER a missing user. Step 1: Create a user for the app Don't run apps as root. If the app is ever compromised, the attacker gets only what this user can touch: sudo useradd --system --create-home --shell /usr/sbin/nologin myapp sudo chown -R myapp:myapp /srv/myapp Step 2: Write the unit file Create /etc/systemd/system/myapp.service . This example runs a Node.js app; swap ExecStart for your language. sudo systemctl edit --full --force myapp creates the file in the right place and reloads systemd when you save: [Unit] Description=My Node.js app After=network-online.target Wants=network-online.target StartLimitIntervalSec=60 StartLimitBurst=5 [Service] Type=simple User=myapp Group=myapp WorkingDirectory=/srv/myapp EnvironmentFile=/srv/myapp/.env Environment=NODE_ENV=production ExecStart=/usr/bin/node dist/main.js Restart=on-failure RestartSec=5 # basic hardening NoNewPrivileges=true PrivateTmp=true ProtectSystem=full ProtectHome=true [Install] WantedBy=multi-user.target What each part does: After= / Wants=network-online.target : start once the network is up, which matters if the app connects to a database on boot. Add postgresql.service to After= if the database is on the same machine. StartLimitIntervalSec and StartLimitBurst (in [Unit] ): if the app fails 5 times in 60 seconds, systemd stops retrying and marks it failed, instead of crash-looping forever. EnvironmentFile : loads KEY=value lines, so secrets stay out of the unit file. Lock it down with chmod 600 . ExecStart needs an absolute path to the binary. Find it with which node . If you use nvm, the path is inside the user's home and changes with each version, which is a common reason the service fails; install Node system-wide for servers. Restart=on-failure restarts on a non-zero exit, a crash or a kill signal, but not when you stop it yourself. Restart=always also restarts after a clean exit, useful for workers that exit on purpose. WantedBy=multi-user.target is what makes enable start it on boot. Step 3: Start it and enable it on boot sudo systemctl daemon-reload sudo systemctl enable --now myapp systemctl status myapp --no-pager enable --now both enables the service for boot and starts it right away. You want to see Active: active (running) . Now test the part that actually matters, recovery: sudo kill -9 $(systemctl show -p MainPID --value myapp) sleep 6; systemctl is-active myapp # active again sudo reboot # then check it came back systemd watches the app's main process. When it dies unexpectedly, systemd waits RestartSec (five seconds here) and starts it again. If it keeps failing, StartLimitBurst stops the loop so you can read the logs. Step 4: Read the logs Anything your app writes to stdout and stderr goes to the systemd journal: journalctl -u myapp -f # follow live journalctl -u myapp -n 100 --no-pager # last 100 lines journalctl -u myapp --since "1 hour ago" journalctl -u myapp -b # since last boot If the journal grows too large on a small disk, cap it with SystemMaxUse=500M in /etc/systemd/journald.conf . My guide on fixing "No space left on device" covers that and other disk hogs. Why won't my systemd service start? Run systemctl status myapp and look at the Main PID or Process line. The status code after code=exited points straight at the problem: status=203/EXEC : systemd couldn't execute ExecStart . The path is wrong, not absolute, or not executable. Check with ls -l /usr/bin/node . Scripts need a shebang and chmod +x . status=200/CHDIR : WorkingDirectory doesn't exist or the user can't enter it. status=217/USER : the User= doesn't exist. status=1/FAILURE : your app started and exited with an error. The reason is in journalctl -u myapp -n 50 : a missing env variable, a database it can't reach, a port already in use (see EADDRINUSE fixes ). "Start request repeated too quickly" : it hit StartLimitBurst . Fix the underlying error, then sudo systemctl reset-failed myapp and start it again. Killed with signal 9 and nothing in your logs : often the kernel's OOM killer. Check journalctl -k | grep -i oom and read my OOM killer guide . Two more tools worth knowing: systemd-analyze verify /etc/systemd/system/myapp.service catches typos in the unit, and systemd-analyze security myapp scores how exposed the service is and lists hardening options you could add. Useful extras Memory cap: MemoryMax=512M stops one leaky app from taking down the whole server. Override without editing: sudo systemctl edit myapp creates a drop-in file for local changes that survive package updates. Graceful reload: if your app reloads config on SIGHUP , add ExecReload=/bin/kill -HUP $MAINPID and use systemctl reload myapp . Scheduled jobs: a .timer unit is a sturdier alternative to cron, with logs in the journal. If your cron jobs silently don't run, see cron job not running . Deploys: a deploy script can just run sudo systemctl restart myapp , then curl a health endpoint and roll back if it fails. That's the pattern in my GitHub Actions deploy with auto-rollback . systemd or PM2 for Node.js? Both work. systemd needs nothing extra and handles any language. PM2 adds Node-specific comforts: cluster mode across CPU cores, pm2 reload for zero-downtime restarts, and a live monitor. I use PM2 for Next.js and NestJS apps (my Next.js on a VPS guide shows the setup) and plain systemd units for everything else. Either way, systemd is what brings it back after a reboot. Frequently asked questions Where do I put a custom systemd service file? In /etc/systemd/system/ , named like myapp.service . That directory is for administrator units and takes priority over the package-provided ones in /lib/systemd/system/ . Do I need to run daemon-reload after editing a service? Yes. systemd caches unit files, so run sudo systemctl daemon-reload after every change and then restart the service. Otherwise it keeps running with the old settings. What's the difference between Restart=always and Restart=on-failure? on-failure restarts only after an error exit, a crash, a kill signal or a timeout. always also restarts after a clean exit with code 0. Neither restarts a service you stopped with systemctl stop . How do I pass environment variables to a systemd service? Use Environment=KEY=value lines for non-secret values and EnvironmentFile=/path/.env for secrets, with the file readable only by root or the service user. Shell syntax like export or quotes around the whole line isn't supported. How do I run a systemd service as a non-root user? Set User= and Group= in the [Service] section, and make sure that user owns the working directory. If the app needs port 80 or 443, put Nginx in front instead of running it as root. Want your server set up properly? I set up and look after Linux servers for businesses: services that recover on their own, logs, backups, monitoring and security hardening. See my Linux system admin services or contact me to talk about your server.

Read article →